
Home / Coverage Areas
San Francisco
Coverage Areas
Citywide coverage — licensed officers and GPS-verified patrol in all 35 San Francisco zones. Pick your district on the map: every zone has its own risk profile, routes, and response plan. PPO #16681 · $3M insured · 24/7 dispatch.
Dimmed areas lie outside San Francisco’s city limits.
Interactive coverage map · all 35 zones · hover a district
Local expertise
We patrol the citywe live in.
National vendors run the same playbook everywhere. AMB designs routes and posts around your block — its risk patterns, response paths, and the realities of San Francisco buildings.
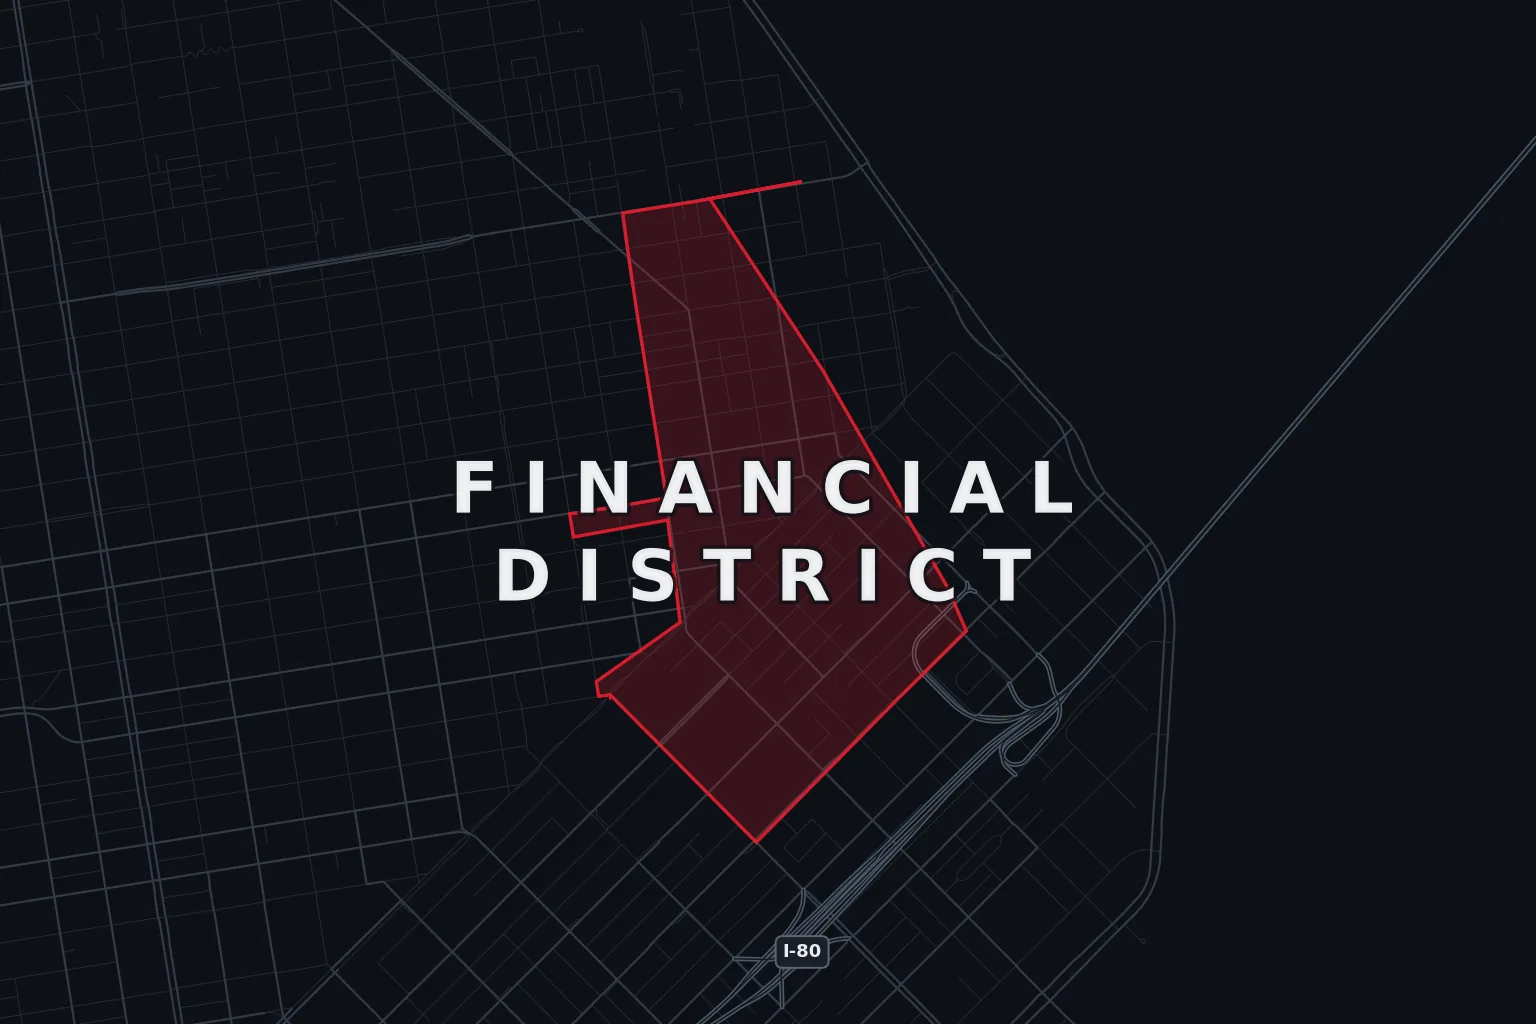 Financial District
Towers empty within 90 minutes at close, cleaning crews work unaccompanied and loading docks go unwatched — the window an on-site officer covers.
View Financial District coverage →
Financial District
Towers empty within 90 minutes at close, cleaning crews work unaccompanied and loading docks go unwatched — the window an on-site officer covers.
View Financial District coverage →
 SoMa
The heaviest load in the city AMB covers — 7,557 incidents, led by drug reports and 909 shoplifting cases.
View SoMa coverage →
SoMa
The heaviest load in the city AMB covers — 7,557 incidents, led by drug reports and 909 shoplifting cases.
View SoMa coverage →
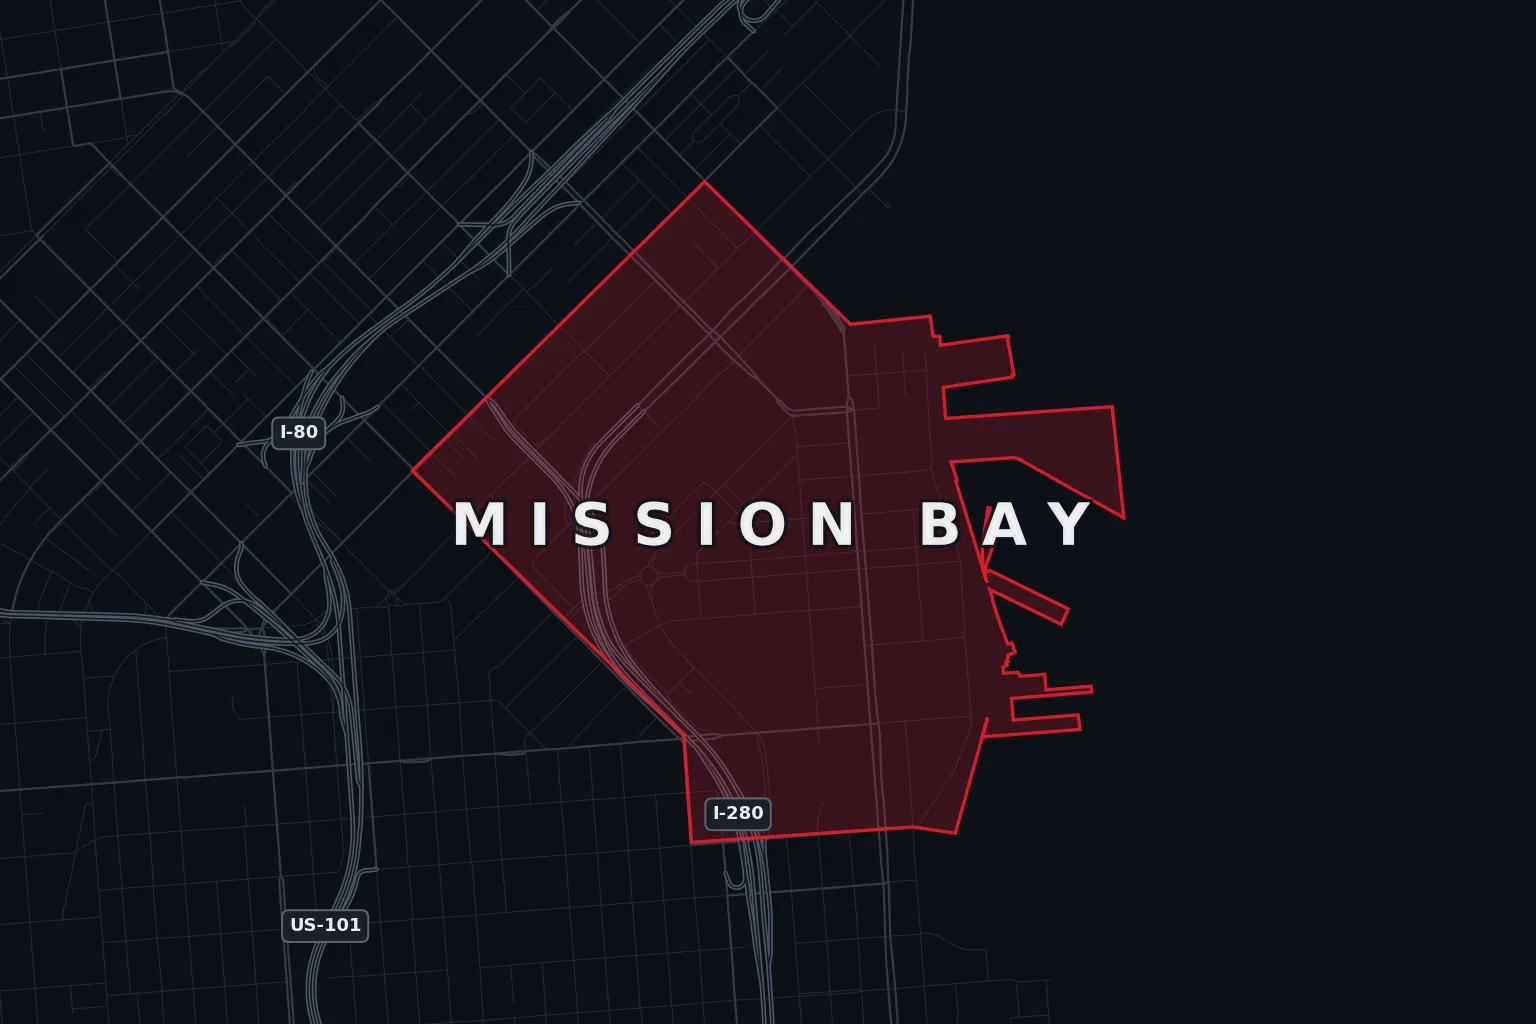 Mission Bay
Biotech and UCSF buildings hold regulated substances, research equipment and samples — access control by officers briefed on lab protocol.
View Mission Bay coverage →
Mission Bay
Biotech and UCSF buildings hold regulated substances, research equipment and samples — access control by officers briefed on lab protocol.
View Mission Bay coverage →
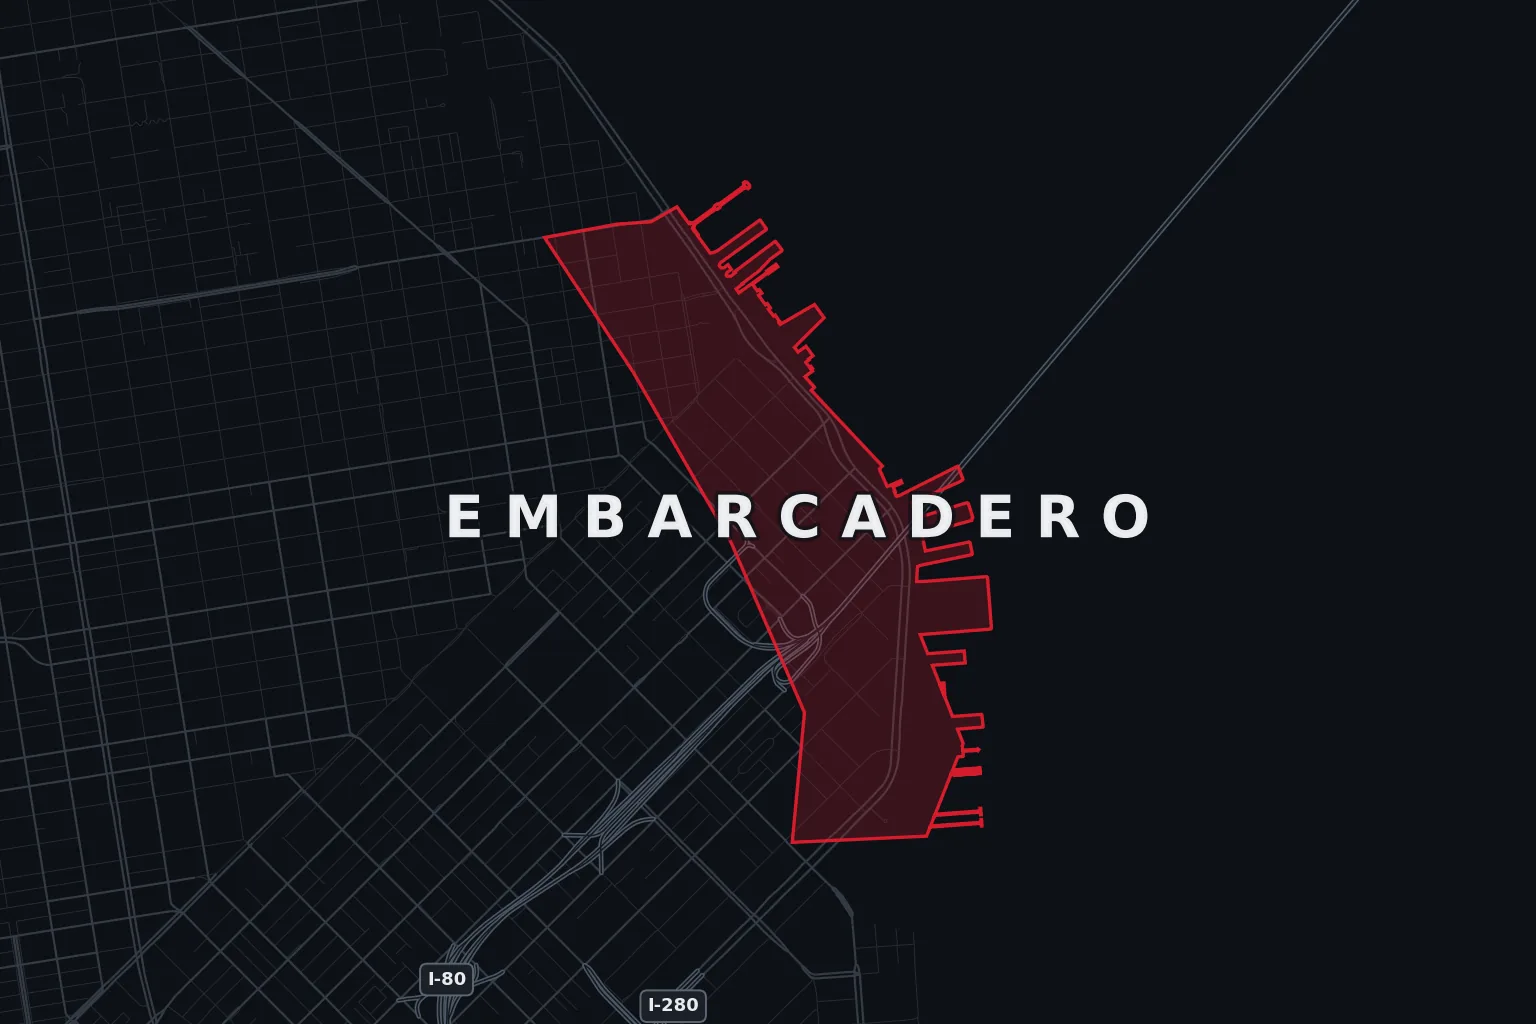 Embarcadero
Ferry Building footfall brings sustained pickpocket and grab-and-run pressure onto adjacent retail and lobby-level tenants.
View Embarcadero coverage →
Embarcadero
Ferry Building footfall brings sustained pickpocket and grab-and-run pressure onto adjacent retail and lobby-level tenants.
View Embarcadero coverage →
 Nob Hill
Landmark hotels face non-guest entry through lobbies, elevators and parking garages, alongside tourist-adjacent opportunistic crime.
View Nob Hill coverage →
Nob Hill
Landmark hotels face non-guest entry through lobbies, elevators and parking garages, alongside tourist-adjacent opportunistic crime.
View Nob Hill coverage →
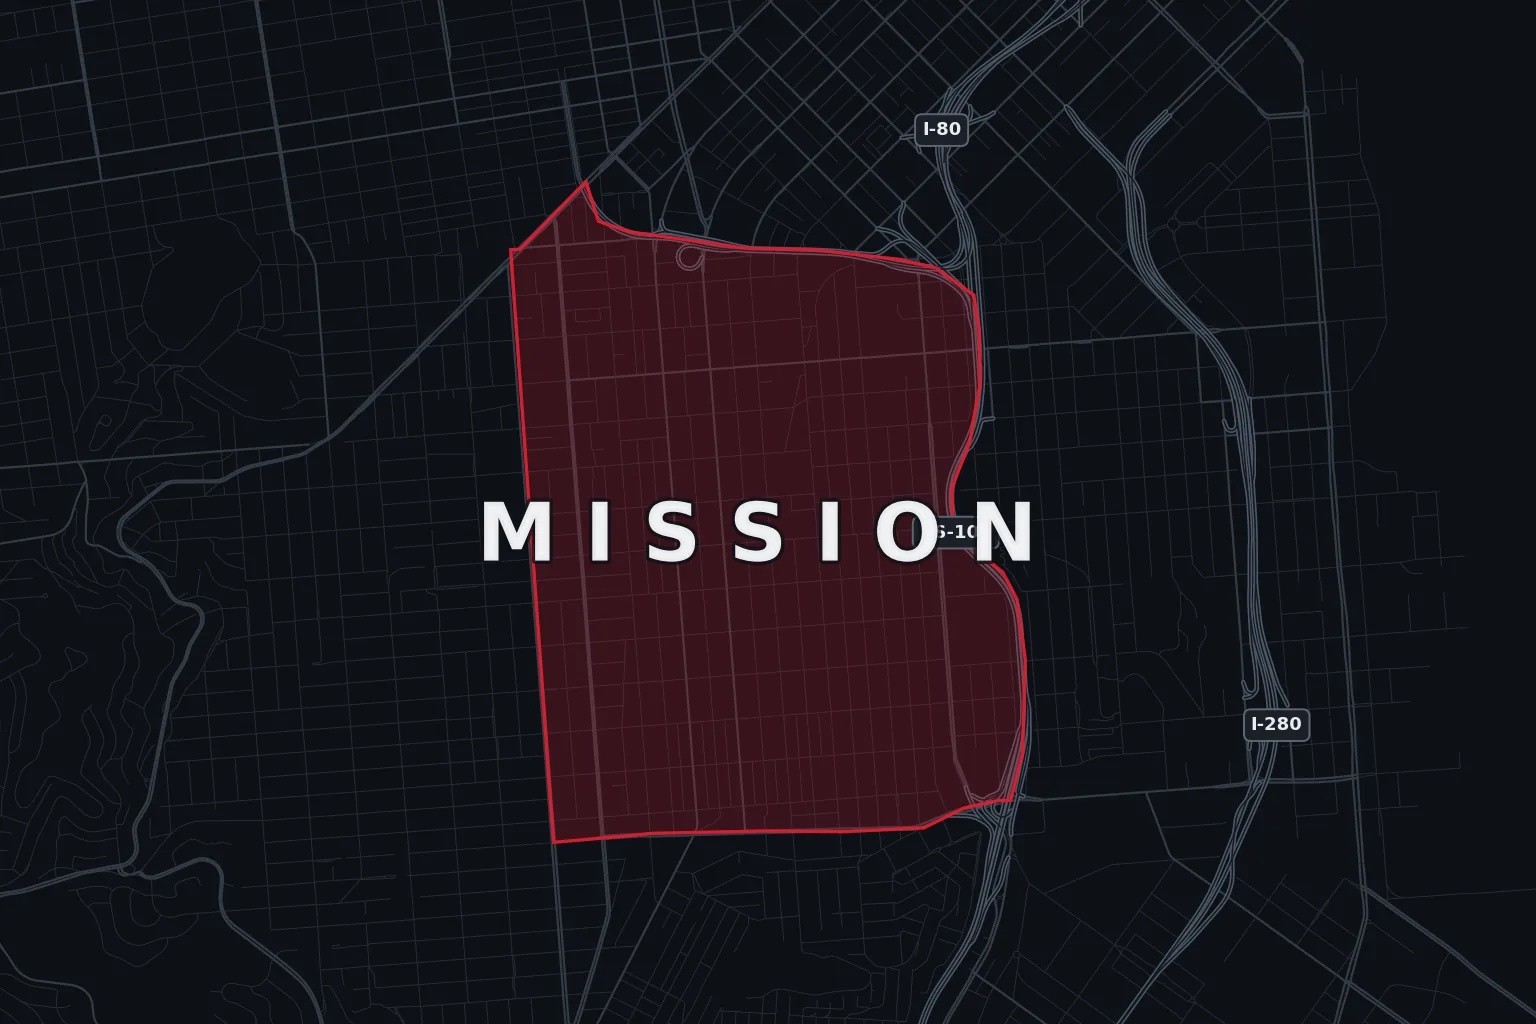 Mission District
9,135 incidents in 12 months. Drug reports dominate the district; what reaches a tenant is assault, larceny and vandalism.
View Mission District coverage →
Mission District
9,135 incidents in 12 months. Drug reports dominate the district; what reaches a tenant is assault, larceny and vandalism.
View Mission District coverage →
All other San Francisco neighborhoods (29)
 Union Square
Straddles two SFPD districts logging 11,291 incidents; flagship retail theft sits inside a wider street-conditions problem.
View Union Square coverage →
Union Square
Straddles two SFPD districts logging 11,291 incidents; flagship retail theft sits inside a wider street-conditions problem.
View Union Square coverage →
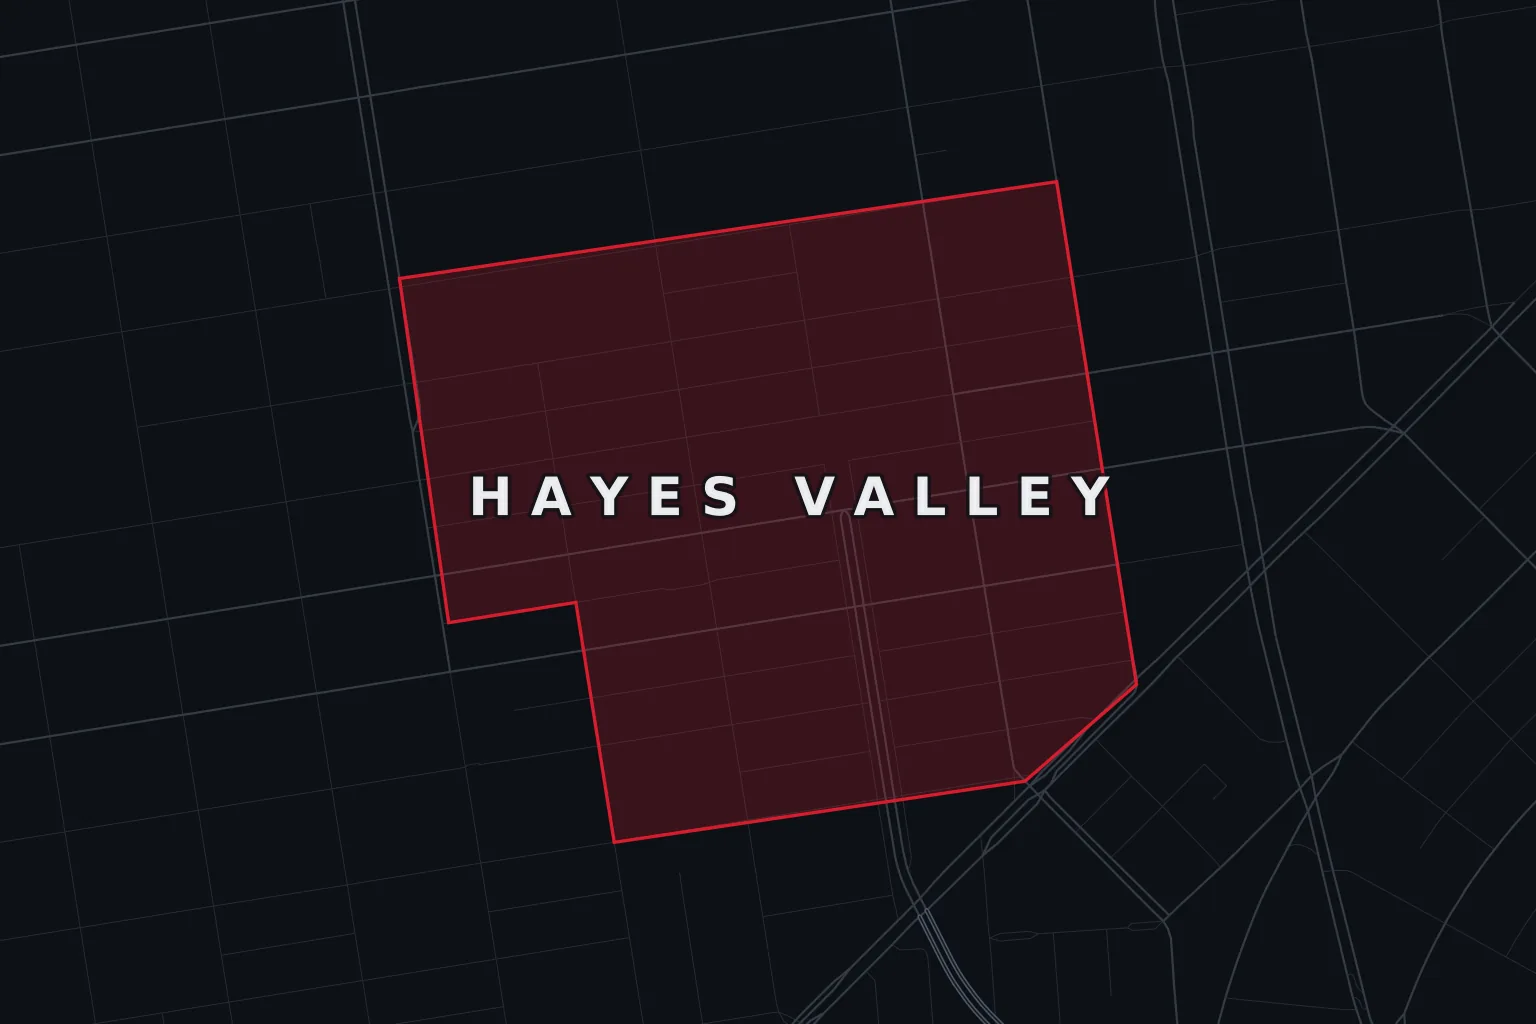 Hayes Valley
296 larceny and 149 vehicle break-ins around Hayes Street — the kerb and the storefront, not the sales floor.
View Hayes Valley coverage →
Hayes Valley
296 larceny and 149 vehicle break-ins around Hayes Street — the kerb and the storefront, not the sales floor.
View Hayes Valley coverage →
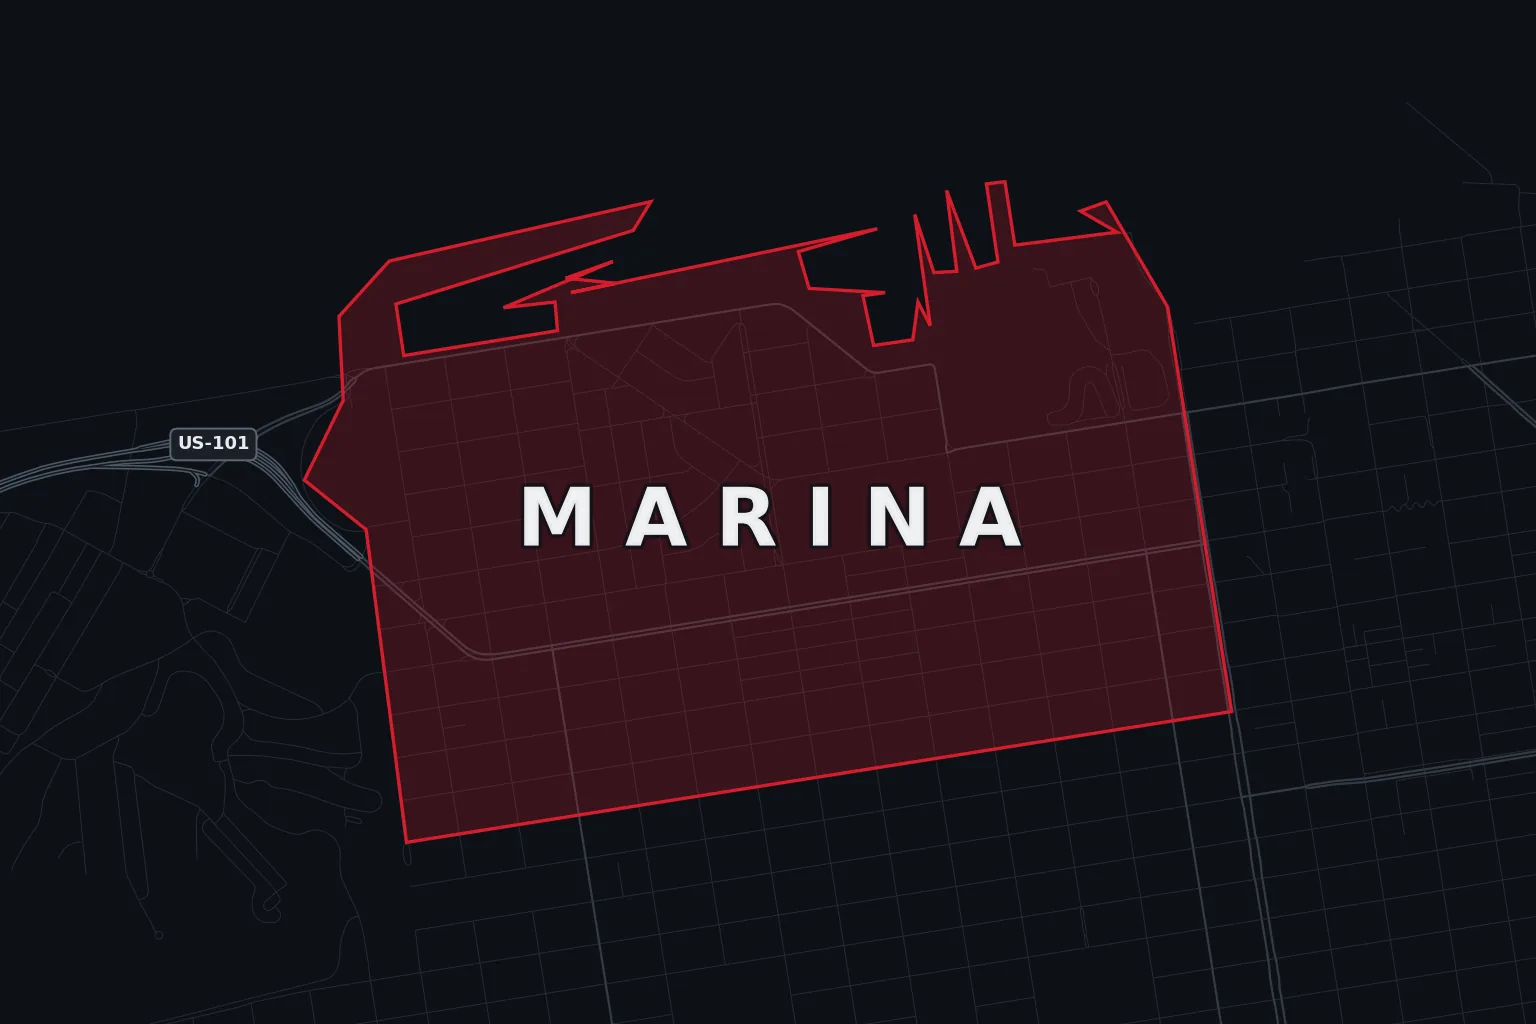 Marina District
Some of the city’s highest vehicle burglary rates, with rental cars and out-of-state plates the primary target near the waterfront.
View Marina District coverage →
Marina District
Some of the city’s highest vehicle burglary rates, with rental cars and out-of-state plates the primary target near the waterfront.
View Marina District coverage →
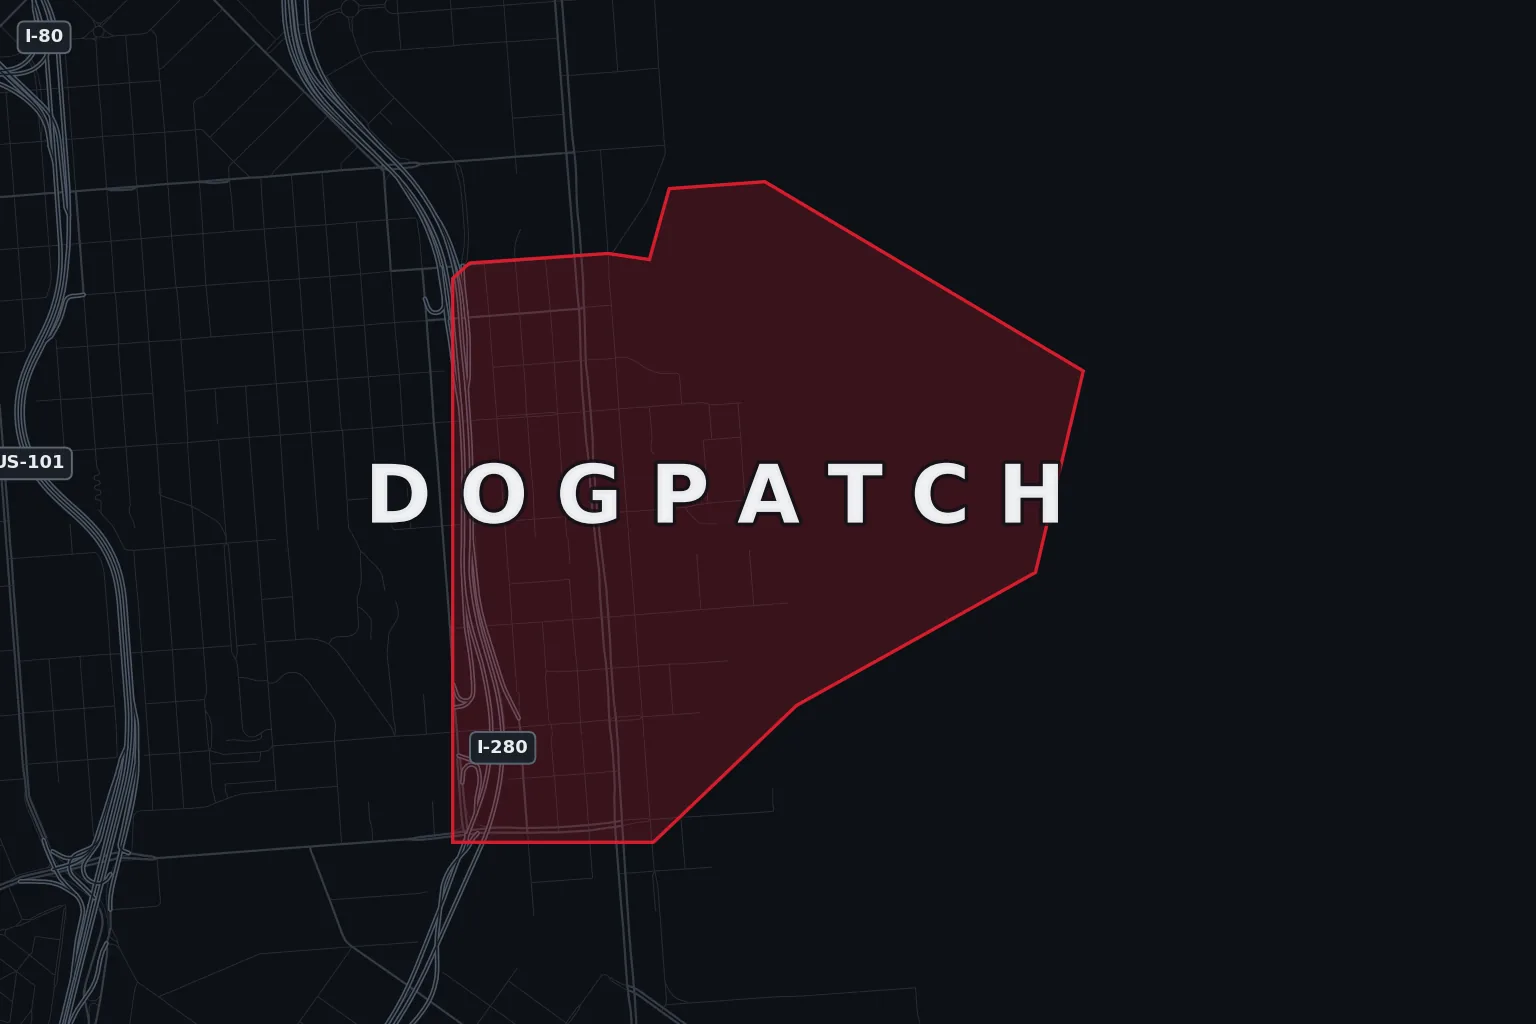 Dogpatch
Inside Potrero Hill’s reporting district: 152 vehicle break-ins lead, alongside after-hours risk to studio equipment.
View Dogpatch coverage →
Dogpatch
Inside Potrero Hill’s reporting district: 152 vehicle break-ins lead, alongside after-hours risk to studio equipment.
View Dogpatch coverage →
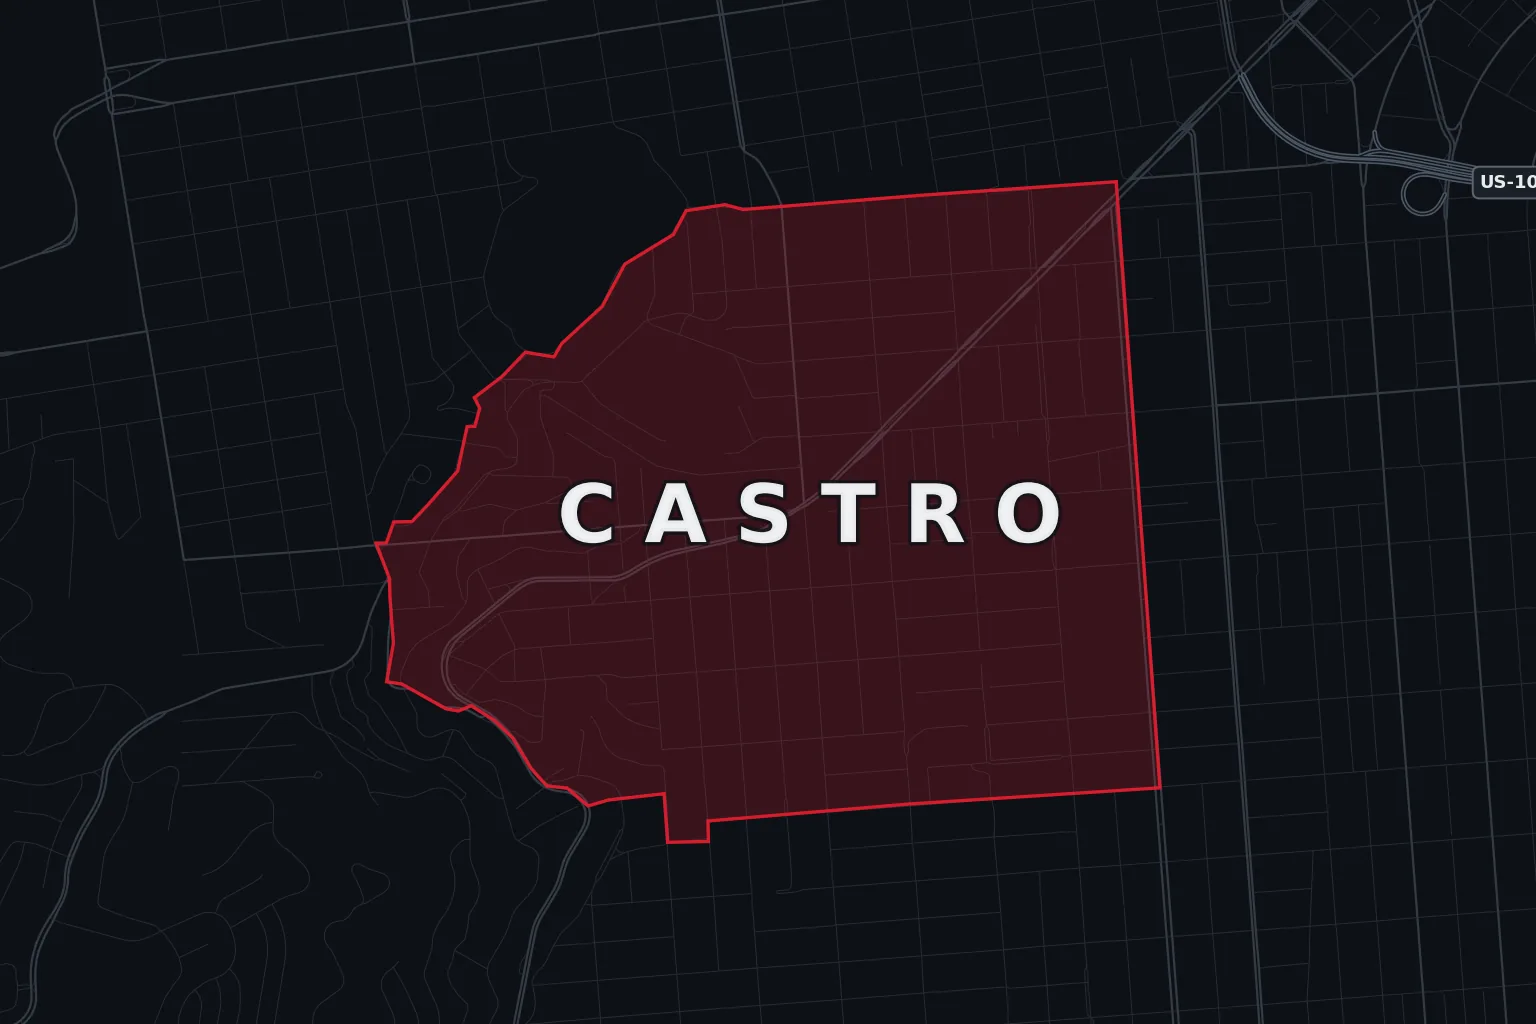 Castro
General larceny is nearly a quarter of everything logged here — 374 reports, ahead of assault, vandalism and car break-ins.
View Castro coverage →
Castro
General larceny is nearly a quarter of everything logged here — 374 reports, ahead of assault, vandalism and car break-ins.
View Castro coverage →
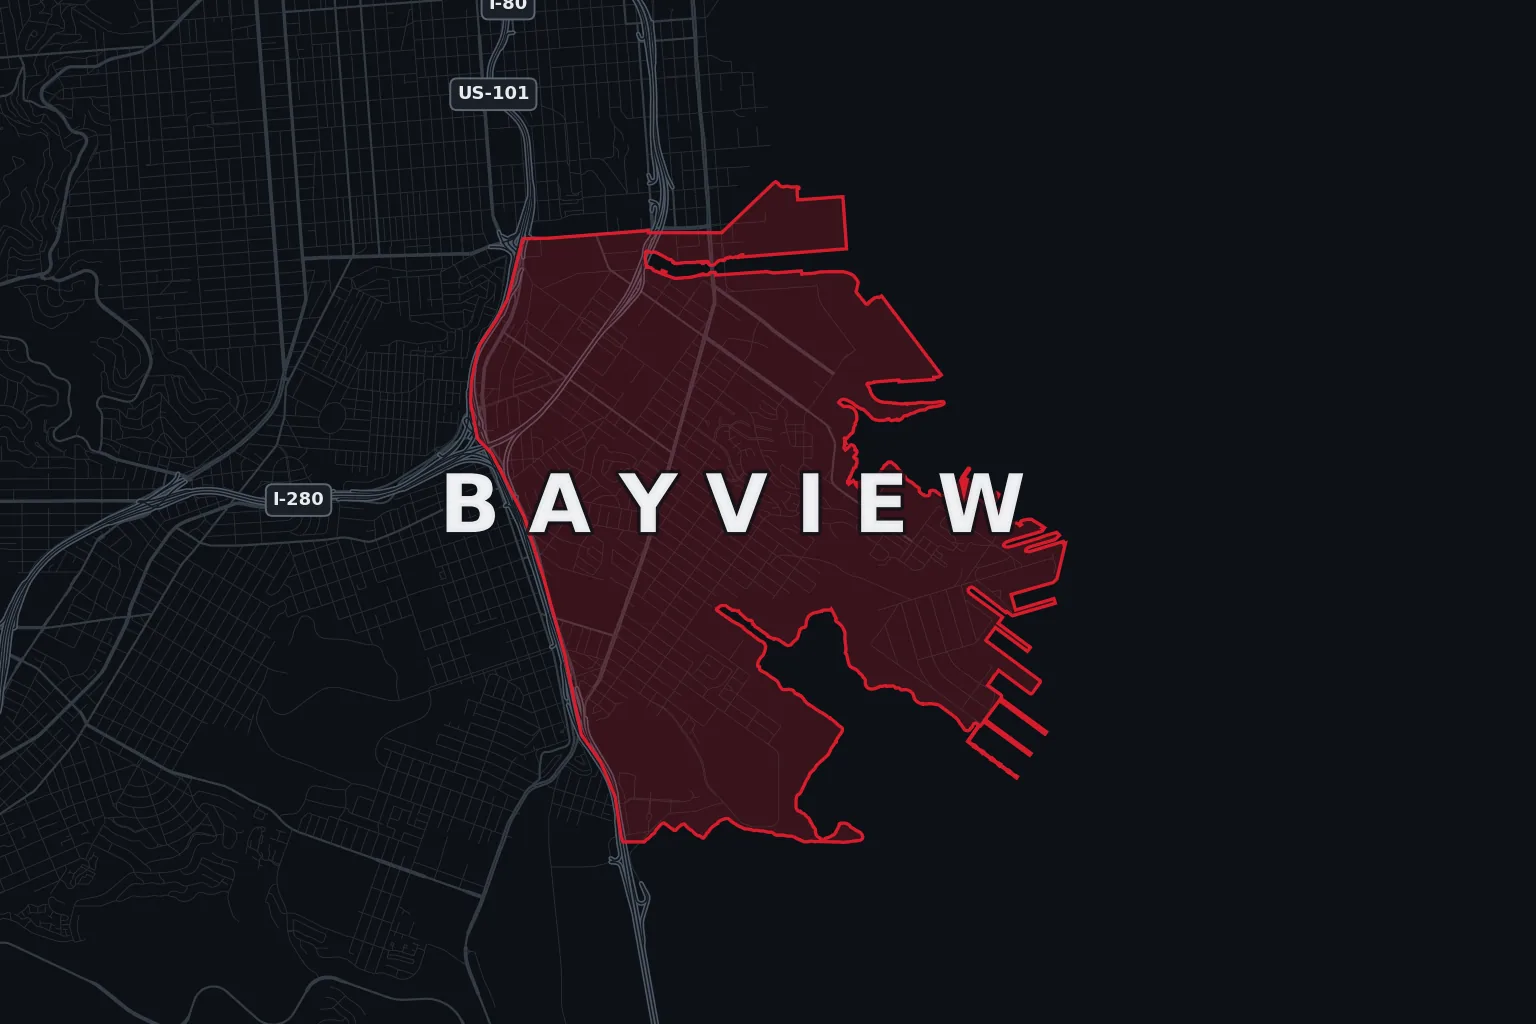 Bayview
Construction sites and industrial yards lose heavy equipment, copper and tools on nights, weekends and holidays when nobody is on site.
View Bayview coverage →
Bayview
Construction sites and industrial yards lose heavy equipment, copper and tools on nights, weekends and holidays when nobody is on site.
View Bayview coverage →
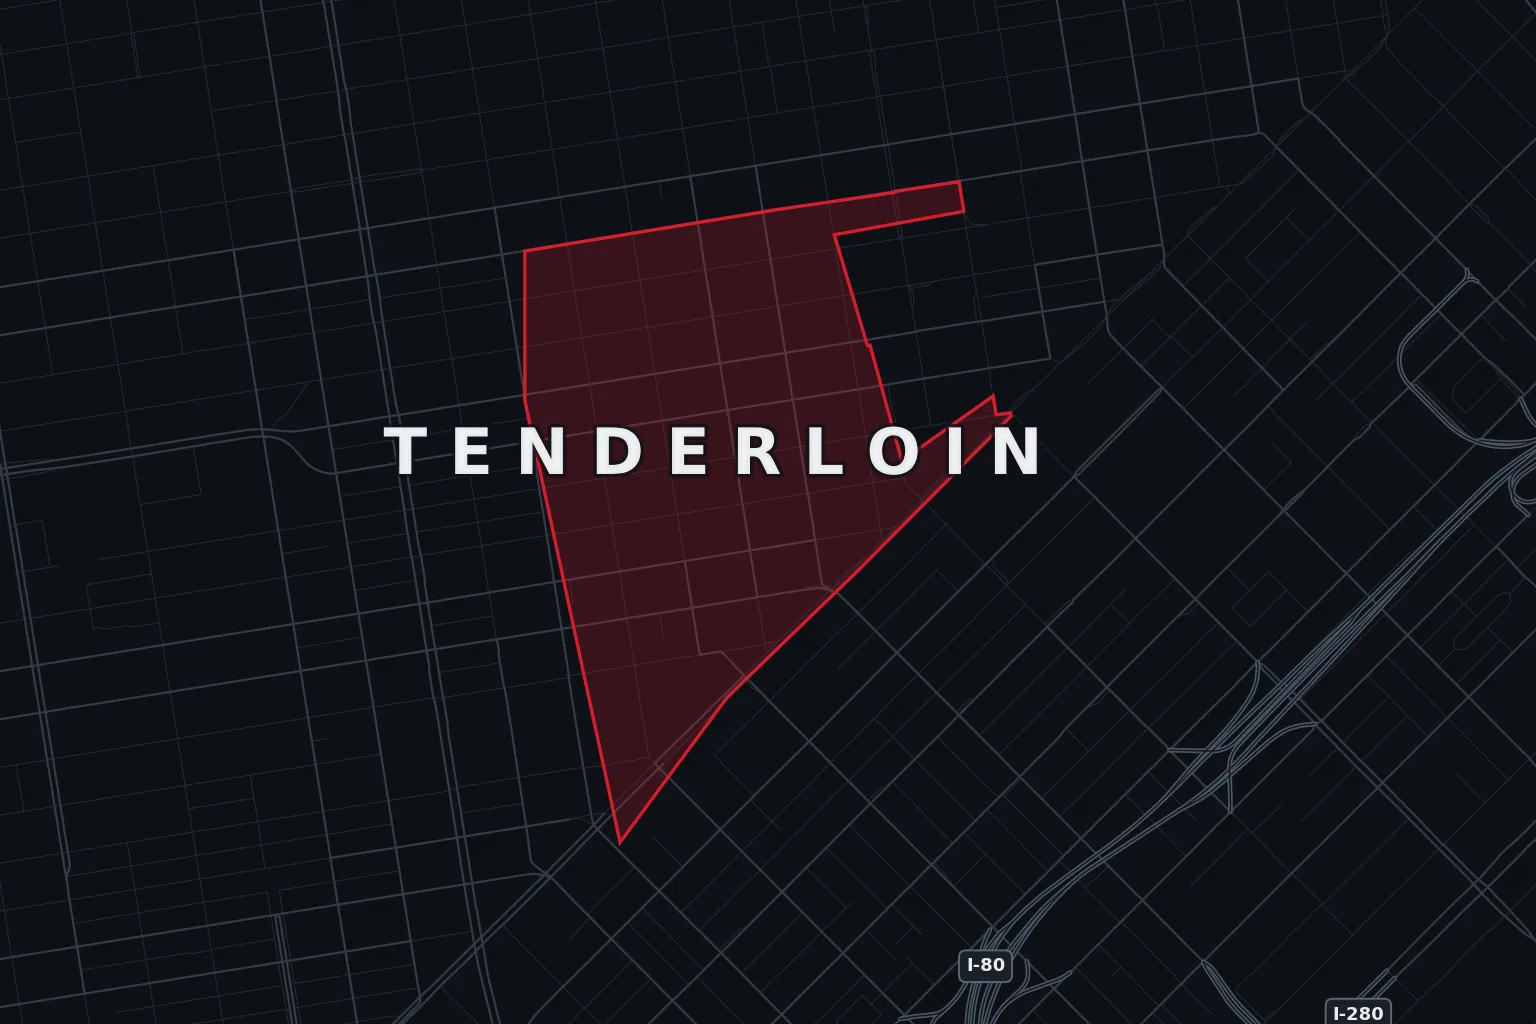 Tenderloin Perimeter
The district logs 8,314 incidents a year; perimeter buildings feel it as unauthorised entry and lobby tailgating.
View Tenderloin Perimeter coverage →
Tenderloin Perimeter
The district logs 8,314 incidents a year; perimeter buildings feel it as unauthorised entry and lobby tailgating.
View Tenderloin Perimeter coverage →
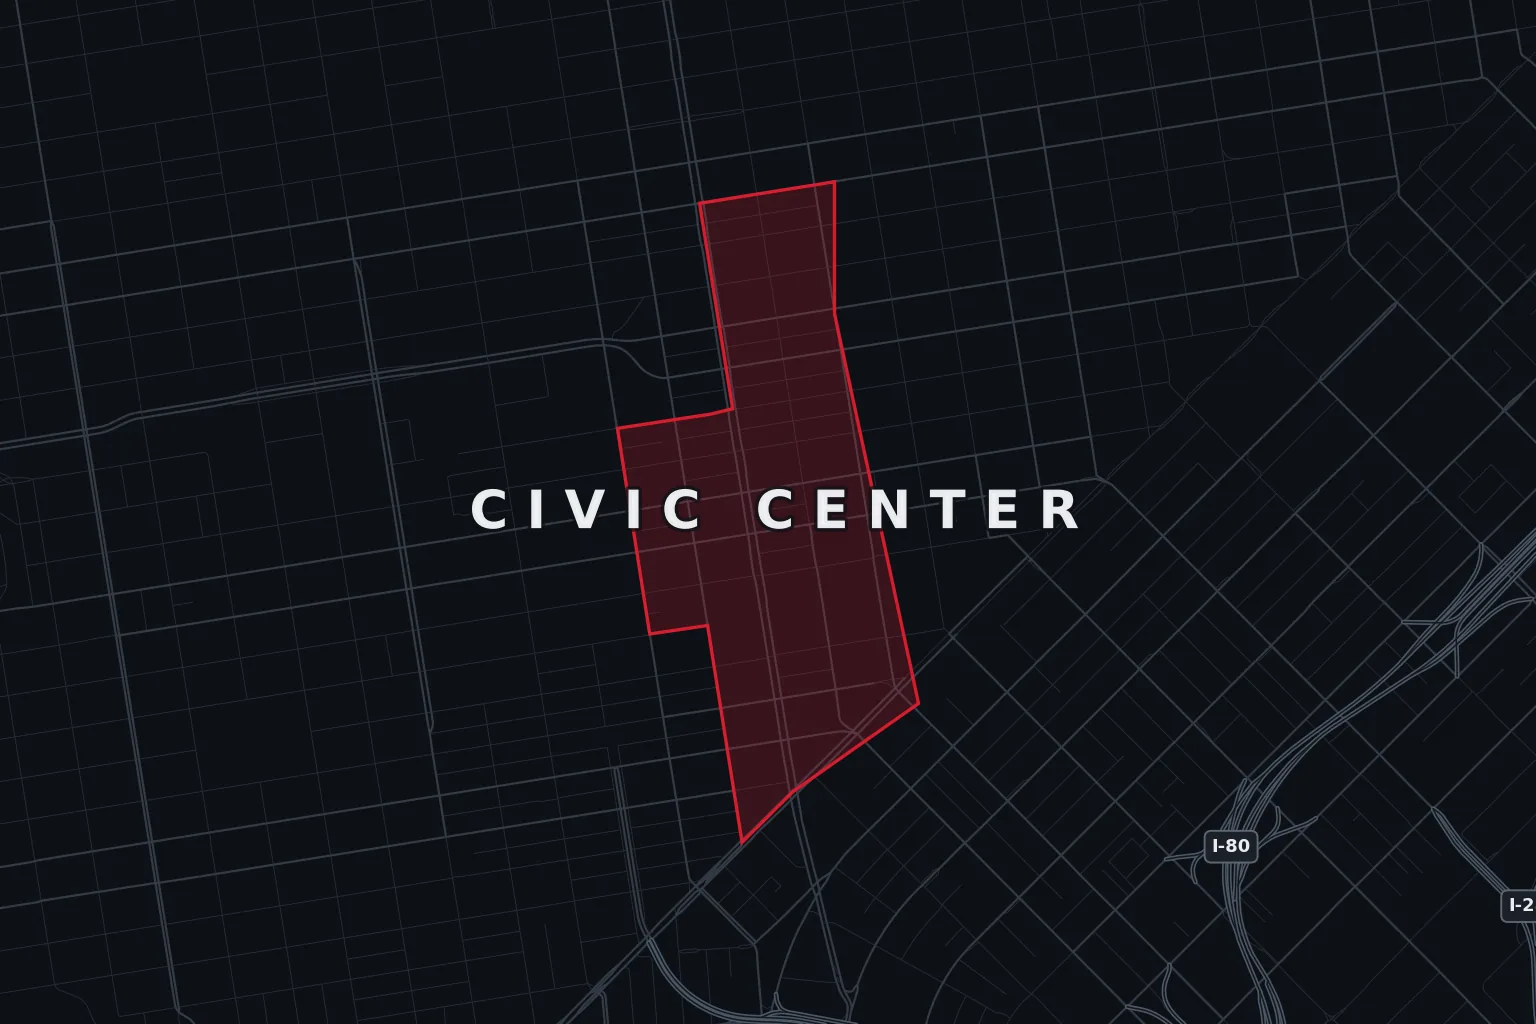 Civic Center
Inside SFPD’s Tenderloin district and its 8,314 incidents — patron-facing risk on Grove and Van Ness outweighs parked cars.
View Civic Center coverage →
Civic Center
Inside SFPD’s Tenderloin district and its 8,314 incidents — patron-facing risk on Grove and Van Ness outweighs parked cars.
View Civic Center coverage →
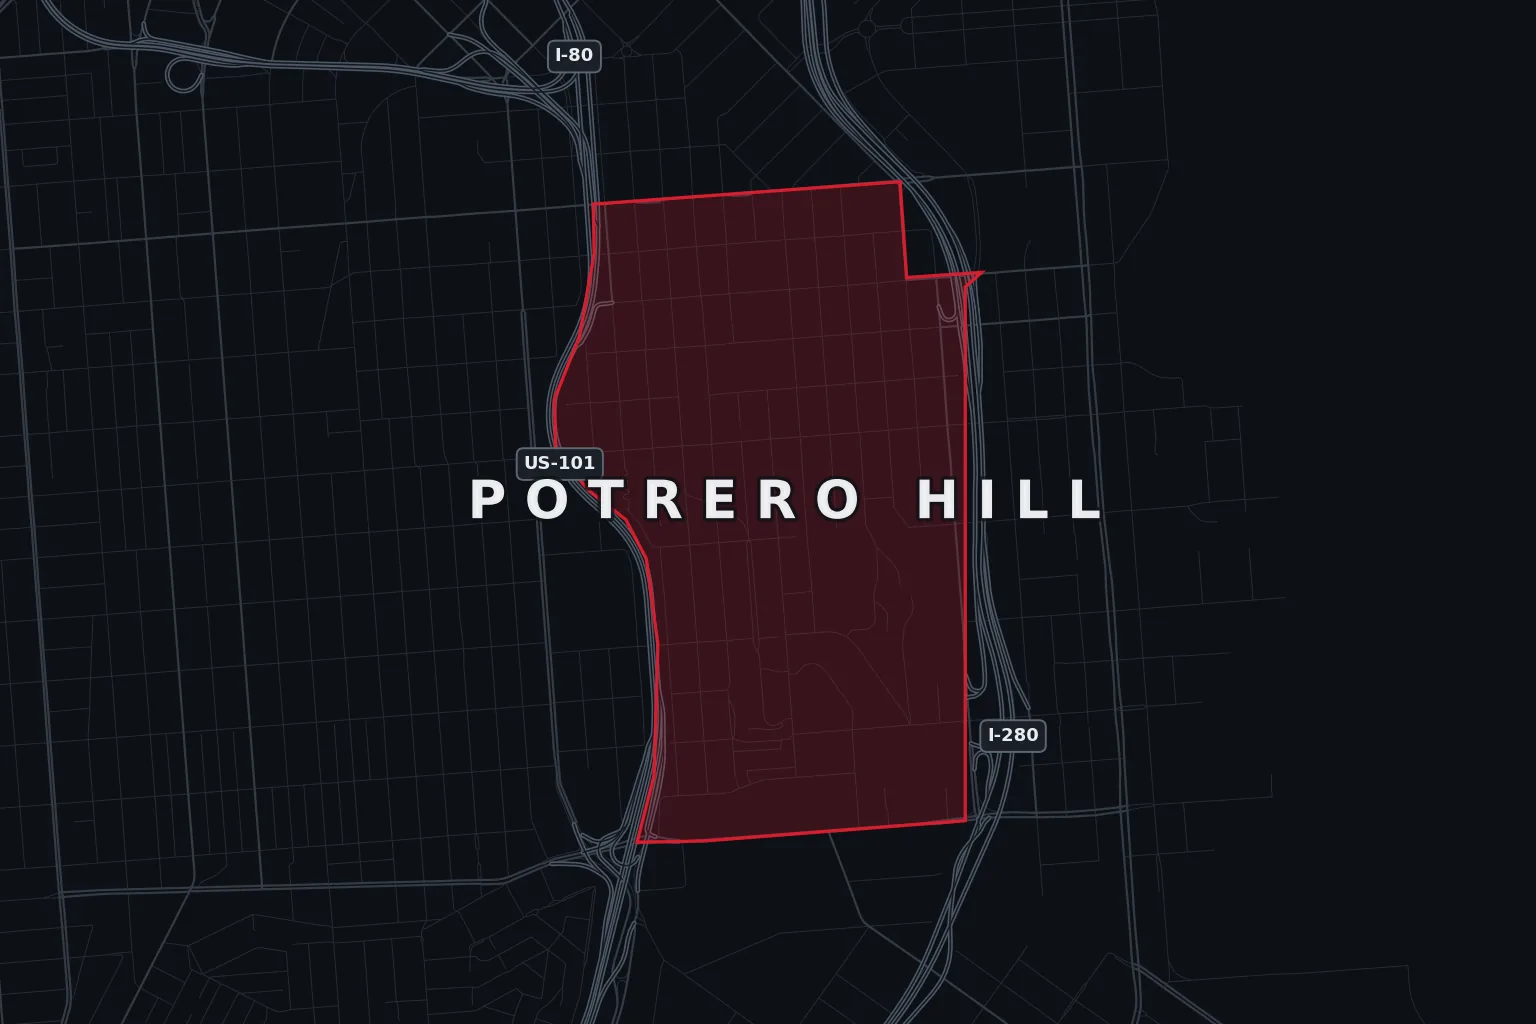 Potrero Hill
152 vehicle break-ins is the largest property line — staff and client cars on Kansas and De Haro through the working day.
View Potrero Hill coverage →
Potrero Hill
152 vehicle break-ins is the largest property line — staff and client cars on Kansas and De Haro through the working day.
View Potrero Hill coverage →
 Chinatown
127 vandalism and 103 vehicle break-ins on Grant and Stockton; till-area loss rarely reaches a police report at all.
View Chinatown coverage →
Chinatown
127 vandalism and 103 vehicle break-ins on Grant and Stockton; till-area loss rarely reaches a police report at all.
View Chinatown coverage →
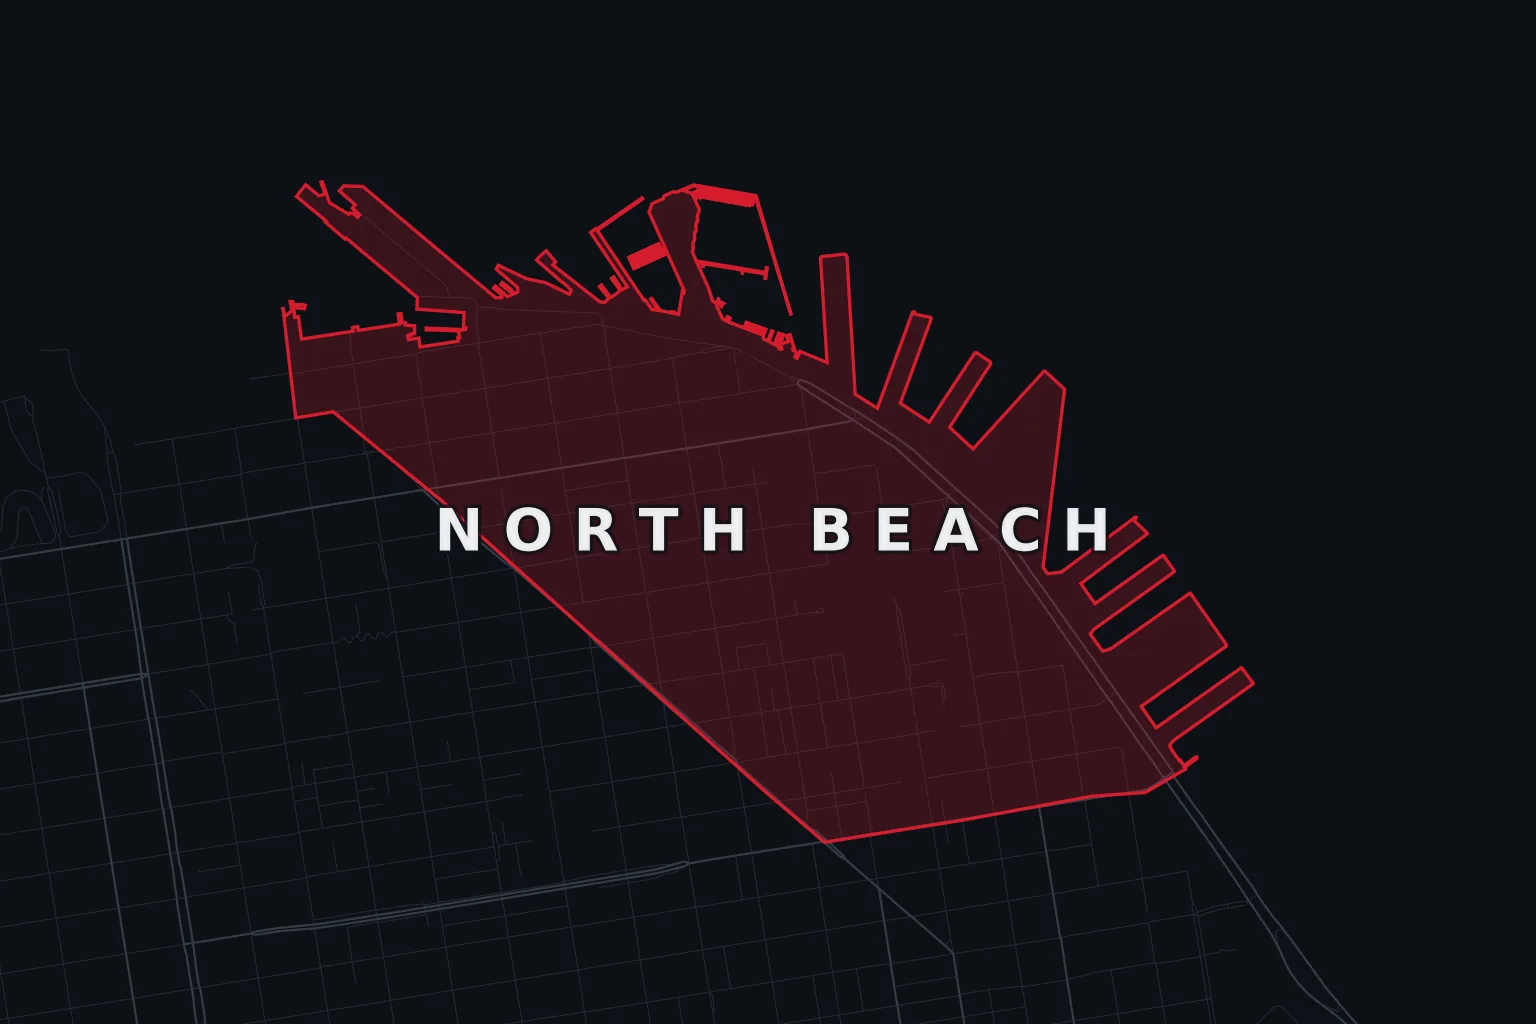 North Beach
Nightlife arithmetic: 113 assaults and 109 vandalism reports outweigh any single theft line when Broadway and Kearny let out.
View North Beach coverage →
North Beach
Nightlife arithmetic: 113 assaults and 109 vandalism reports outweigh any single theft line when Broadway and Kearny let out.
View North Beach coverage →
 Richmond District
Inner and Outer Richmond log 1,542 incidents — larceny, vandalism and fraud ahead of overnight forced entry.
View Richmond District coverage →
Richmond District
Inner and Outer Richmond log 1,542 incidents — larceny, vandalism and fraud ahead of overnight forced entry.
View Richmond District coverage →
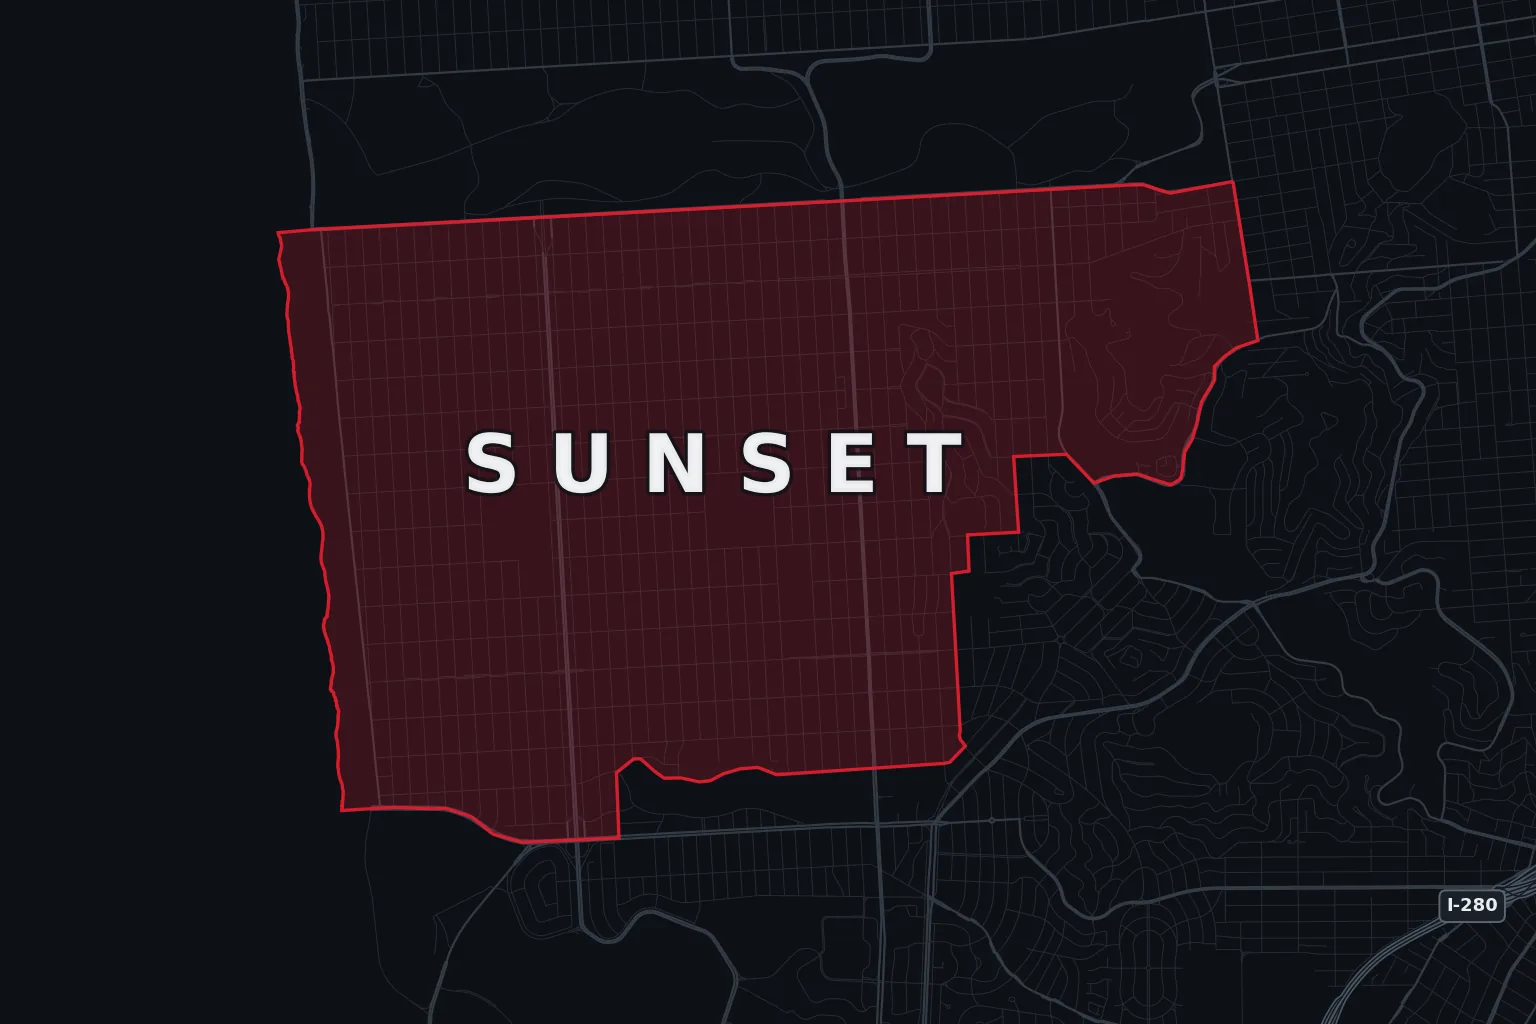 Sunset District
Fraud leads at 290, then larceny, vandalism and 217 vehicle break-ins along Irving Street and 9th Avenue.
View Sunset District coverage →
Sunset District
Fraud leads at 290, then larceny, vandalism and 217 vehicle break-ins along Irving Street and 9th Avenue.
View Sunset District coverage →
 Pacific Heights
Estates and embassies stay a standing burglary target, most of all when a property reads as unoccupied.
View Pacific Heights coverage →
Pacific Heights
Estates and embassies stay a standing burglary target, most of all when a property reads as unoccupied.
View Pacific Heights coverage →
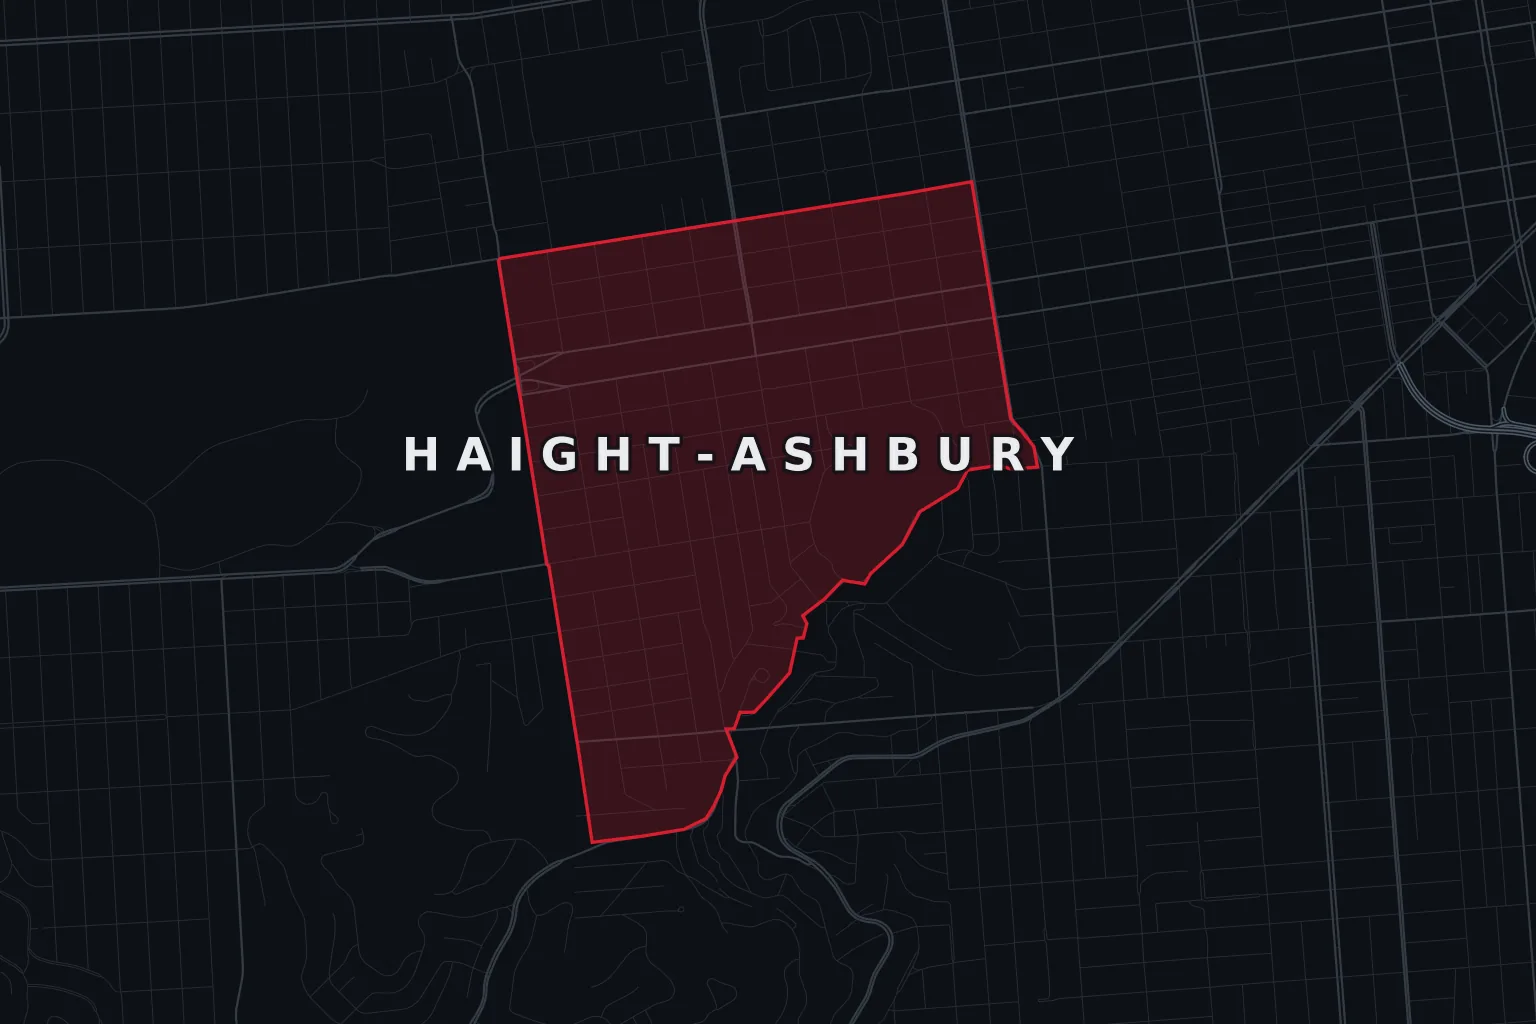 Haight-Ashbury
Vandalism and assault tie at 92 each — what recessed entries between Stanyan and Masonic generate overnight.
View Haight-Ashbury coverage →
Haight-Ashbury
Vandalism and assault tie at 92 each — what recessed entries between Stanyan and Masonic generate overnight.
View Haight-Ashbury coverage →
 Western Addition
209 larceny and 181 vehicle break-ins on Fillmore and Divisadero; recorded shoplifting is a fraction of that at 24.
View Western Addition coverage →
Western Addition
209 larceny and 181 vehicle break-ins on Fillmore and Divisadero; recorded shoplifting is a fraction of that at 24.
View Western Addition coverage →
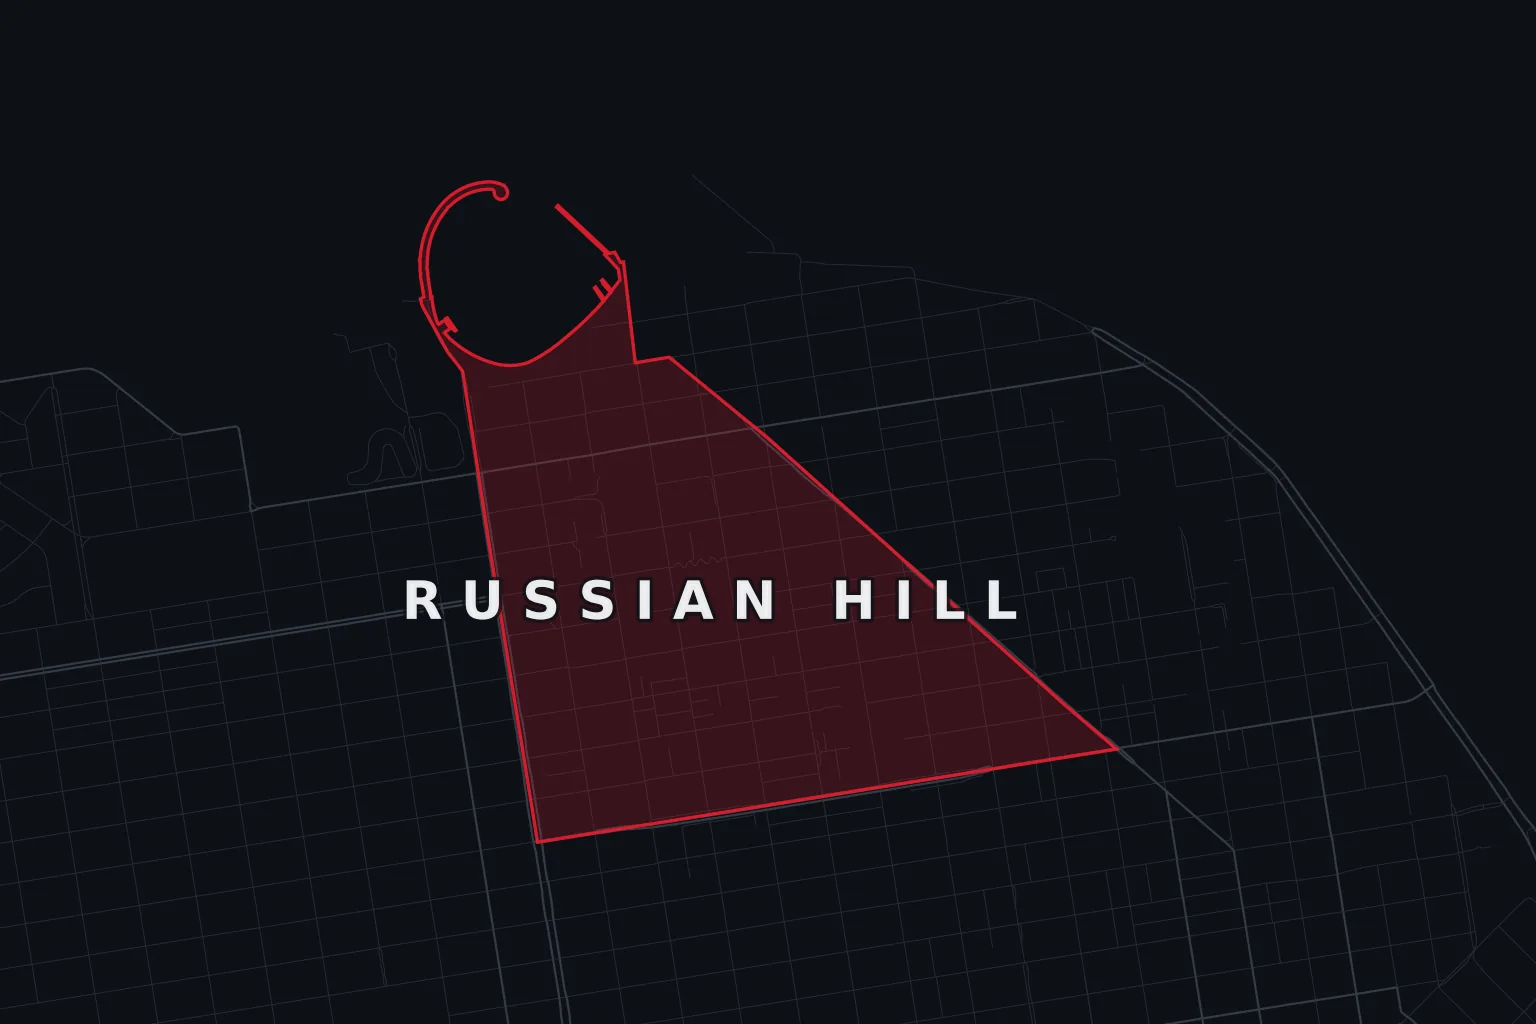 Russian Hill
111 vehicle break-ins in 12 months, second only to general larceny; garage-door pries on the Hyde and Larkin slopes sit lower.
View Russian Hill coverage →
Russian Hill
111 vehicle break-ins in 12 months, second only to general larceny; garage-door pries on the Hyde and Larkin slopes sit lower.
View Russian Hill coverage →
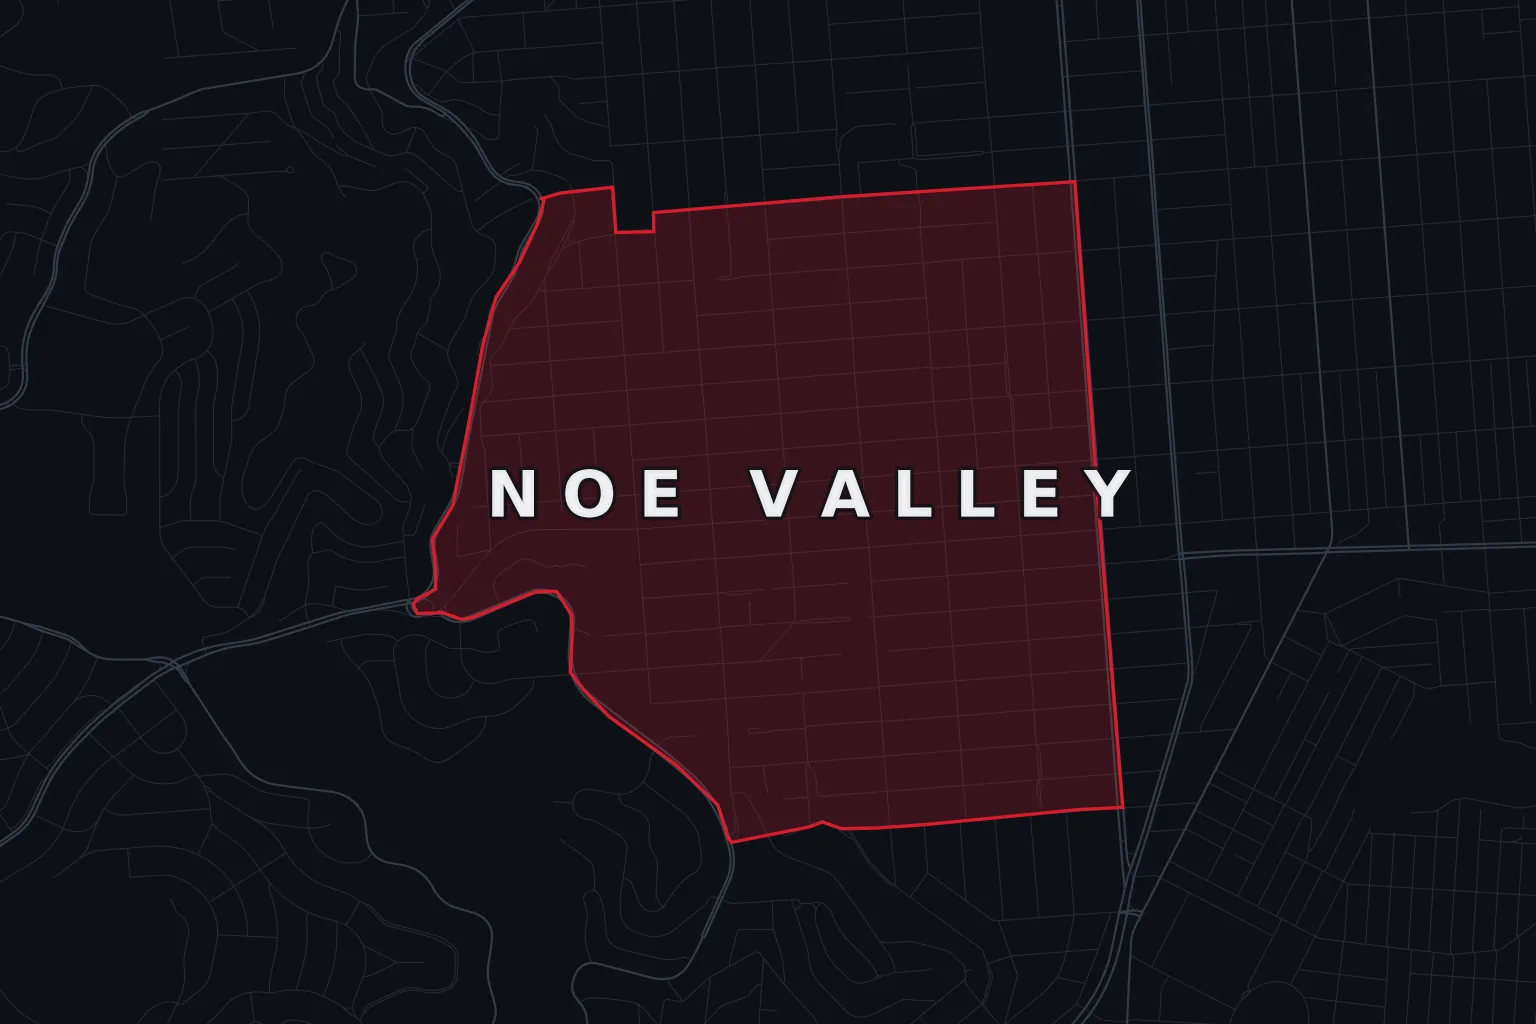 Noe Valley
Theft leads the log — 171 shoplifting and 145 other larceny reports in 12 months, the line that covers parcels off Victorian stoops.
View Noe Valley coverage →
Noe Valley
Theft leads the log — 171 shoplifting and 145 other larceny reports in 12 months, the line that covers parcels off Victorian stoops.
View Noe Valley coverage →
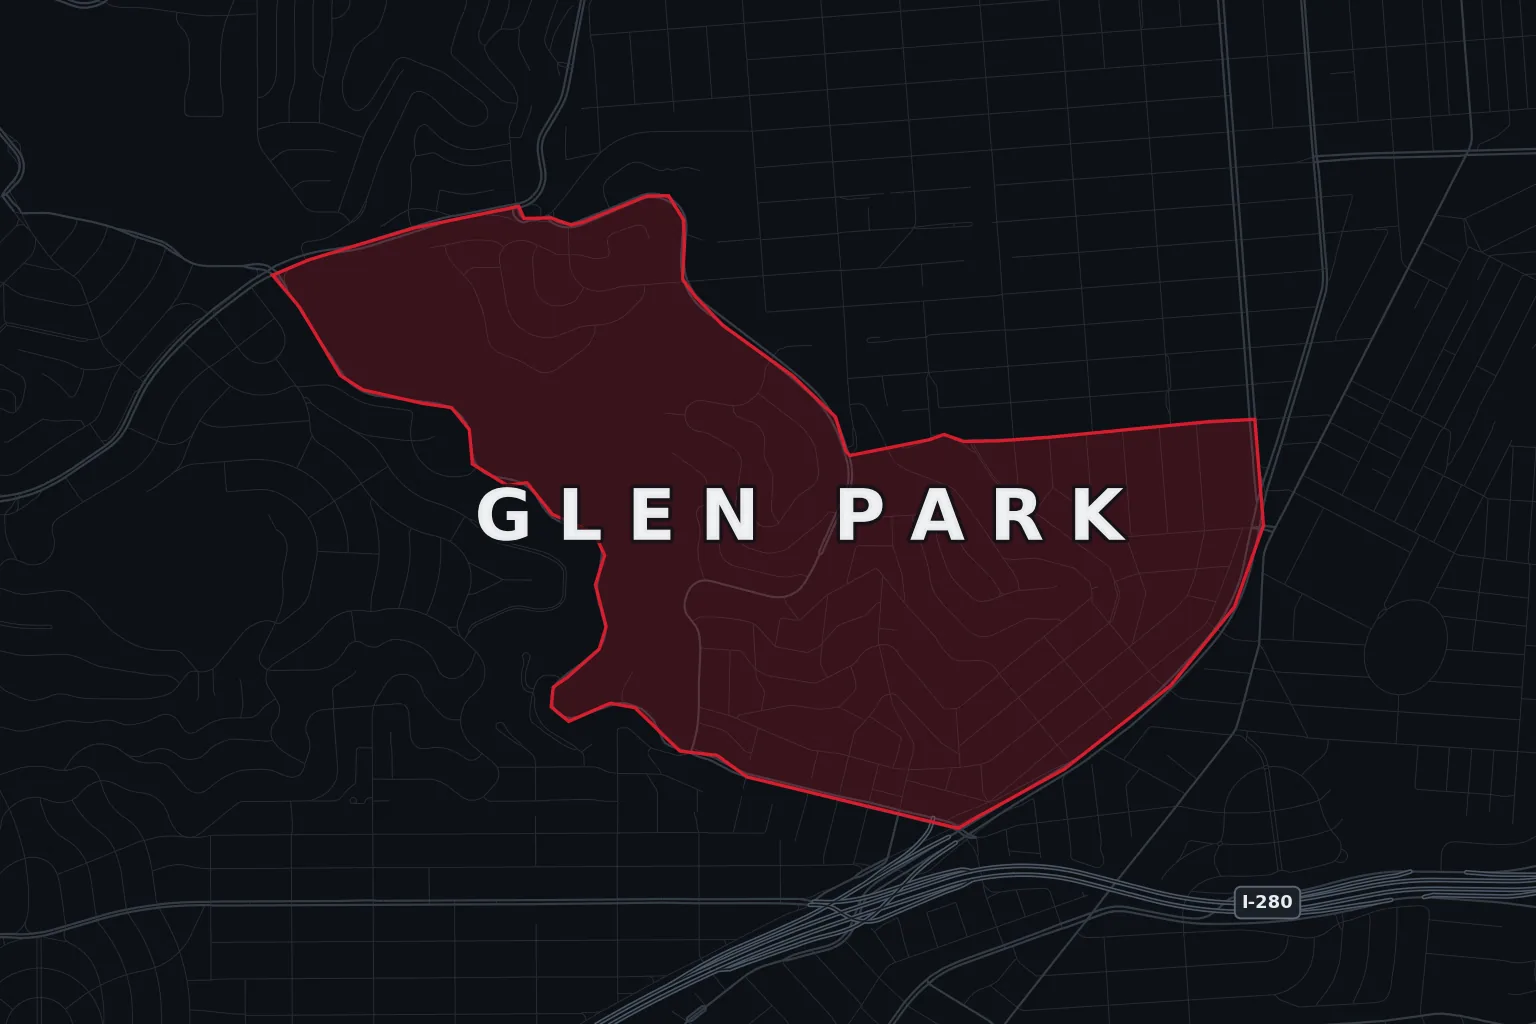 Glen Park
Among the quietest zones AMB covers — 245 incidents a year, which is why coverage here is usually patrol passes.
View Glen Park coverage →
Glen Park
Among the quietest zones AMB covers — 245 incidents a year, which is why coverage here is usually patrol passes.
View Glen Park coverage →
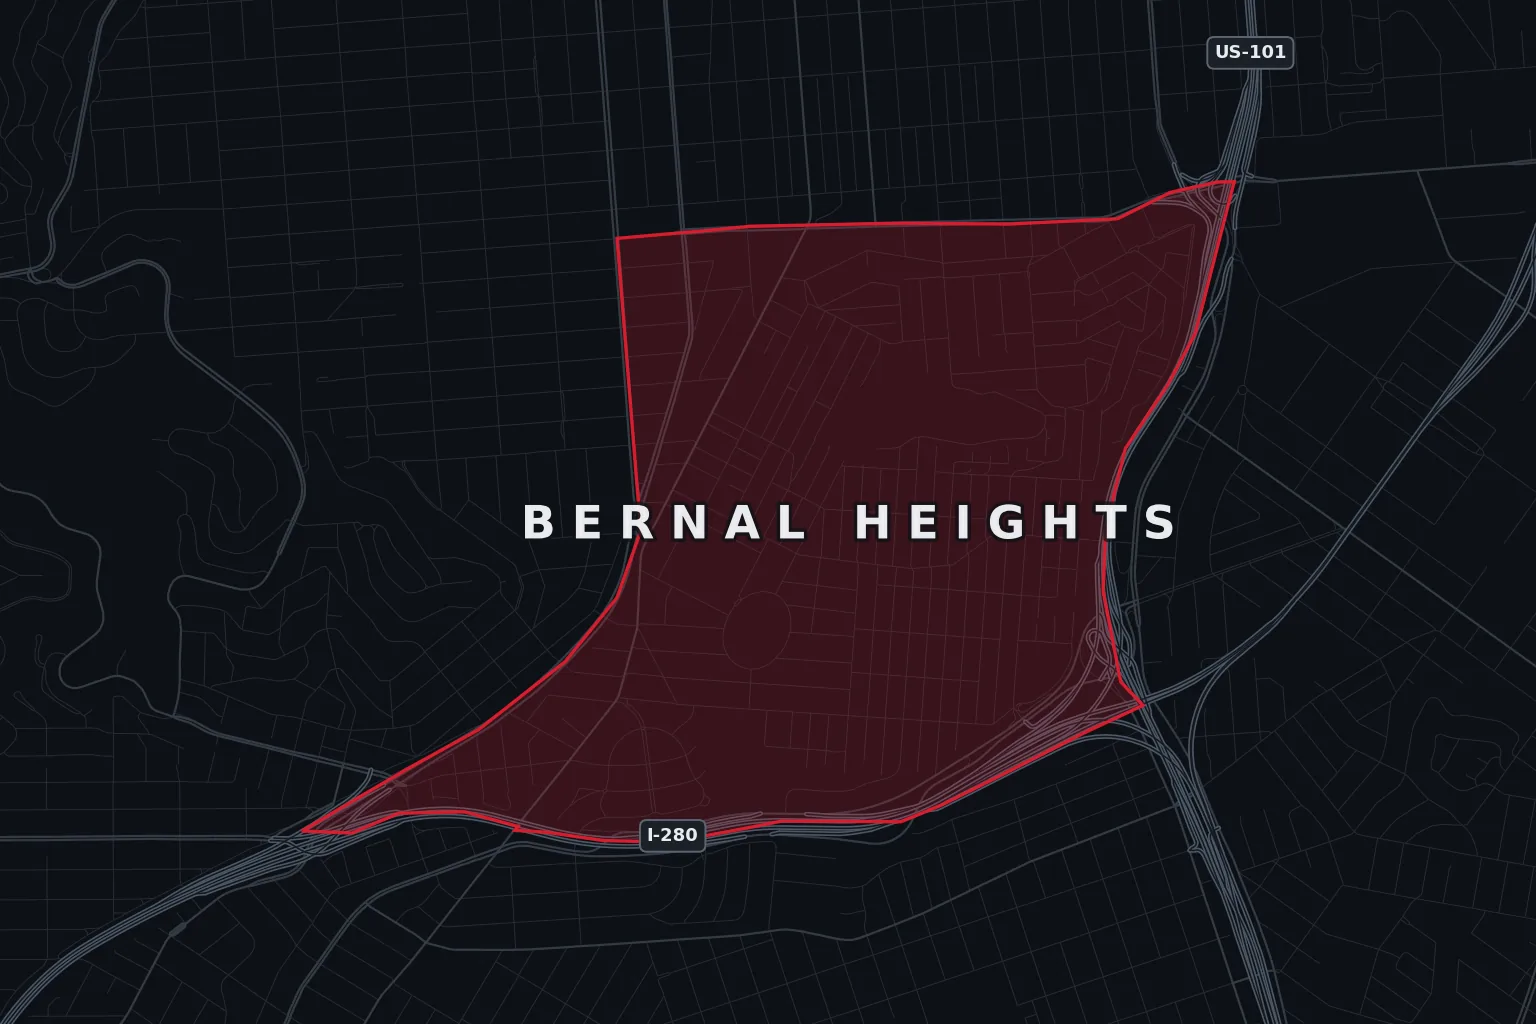 Bernal Heights
122 vandalism and 88 vehicle thefts fill Cortland Avenue’s long unwatched stretch after the shops close early.
View Bernal Heights coverage →
Bernal Heights
122 vandalism and 88 vehicle thefts fill Cortland Avenue’s long unwatched stretch after the shops close early.
View Bernal Heights coverage →
 Excelsior
Vandalism and vehicle theft lead on Mission between Silver and Geneva; burglary of all types totals 44 a year.
View Excelsior coverage →
Excelsior
Vandalism and vehicle theft lead on Mission between Silver and Geneva; burglary of all types totals 44 a year.
View Excelsior coverage →
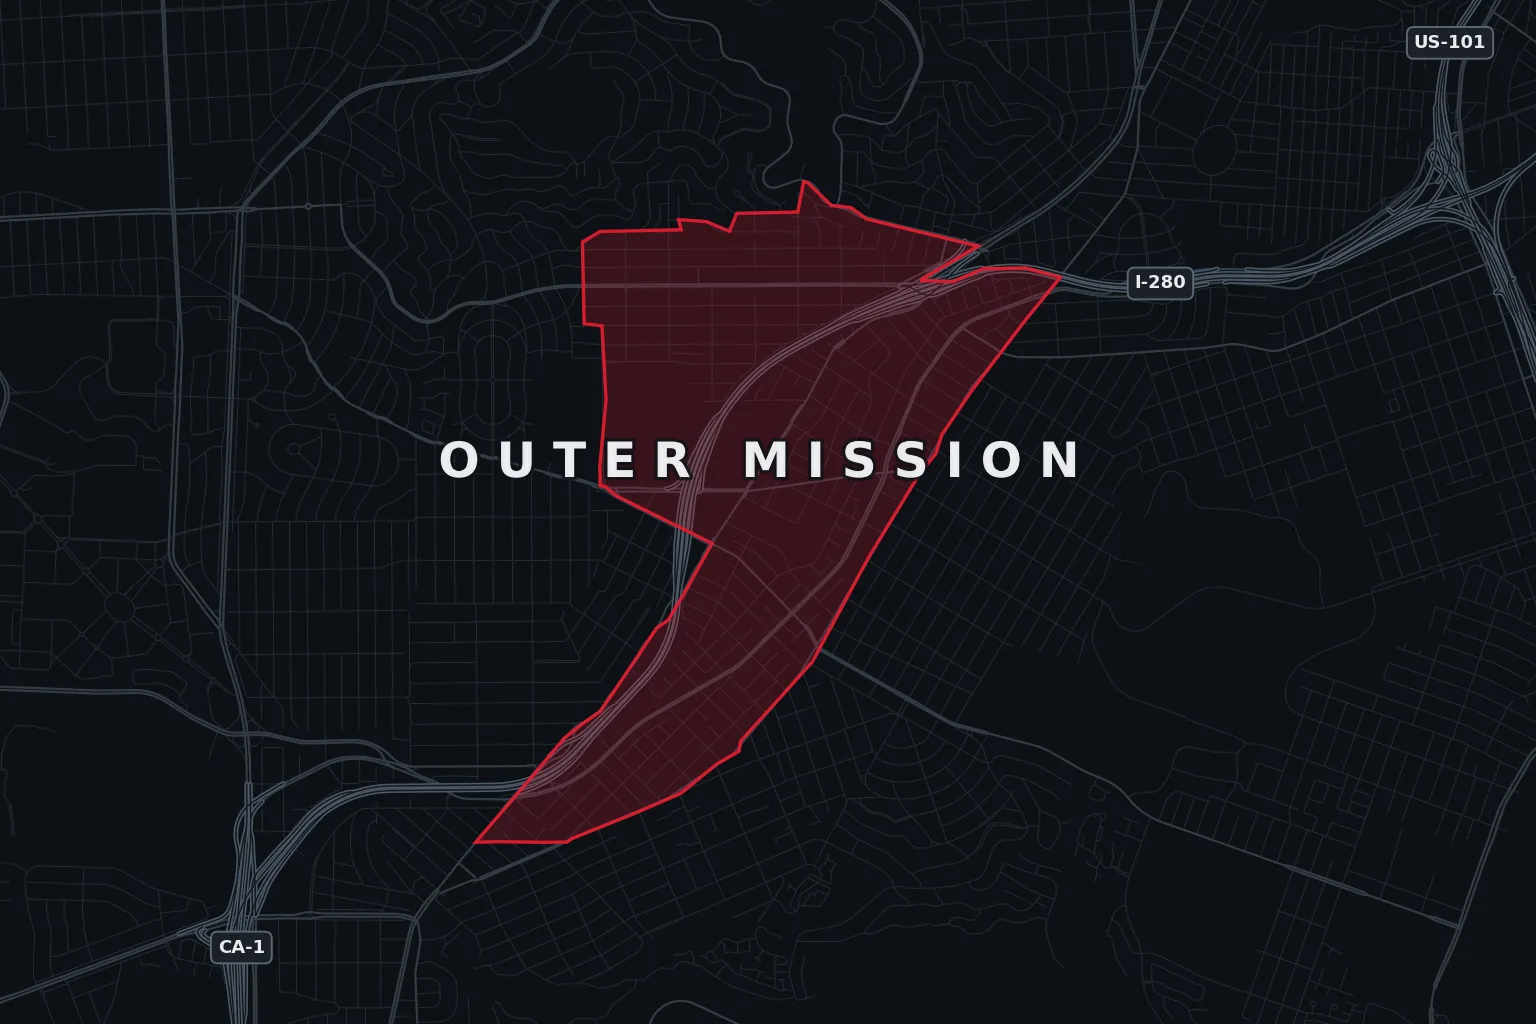 Outer Mission
Repair shops on Mission and Geneva keep customer vehicles and parts in fenced lots overnight — fence cuts and parts stripping recur.
View Outer Mission coverage →
Outer Mission
Repair shops on Mission and Geneva keep customer vehicles and parts in fenced lots overnight — fence cuts and parts stripping recur.
View Outer Mission coverage →
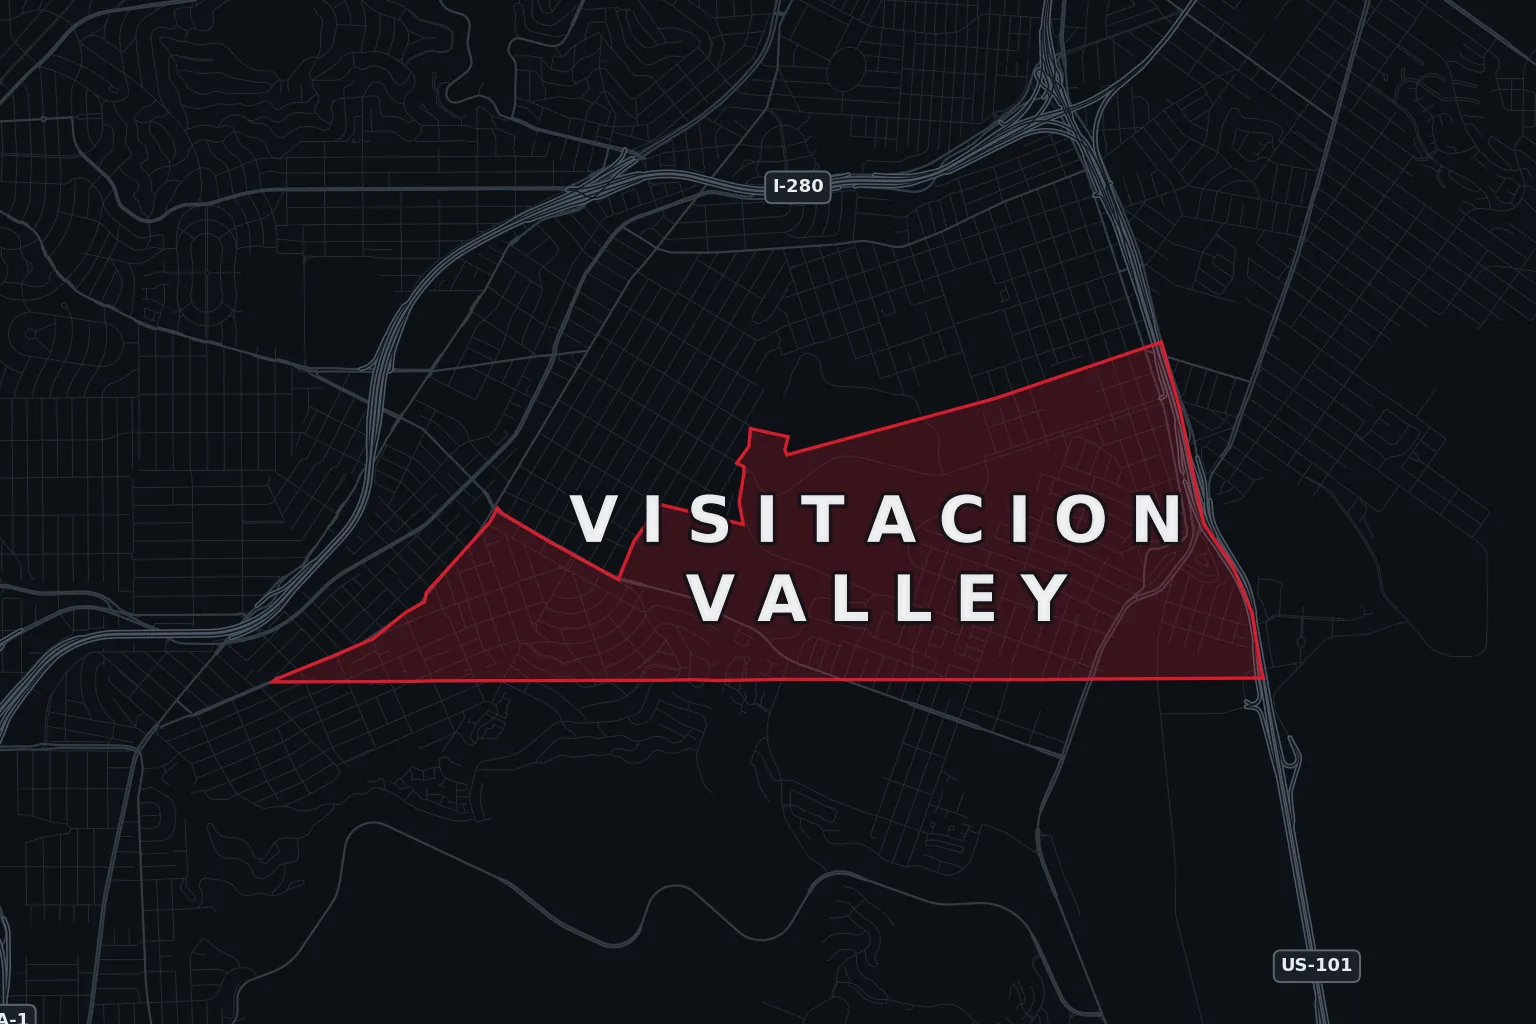 Visitacion Valley
481 incidents, the lowest among the district’s build zones; confrontation and damage outweigh site theft in the record.
View Visitacion Valley coverage →
Visitacion Valley
481 incidents, the lowest among the district’s build zones; confrontation and damage outweigh site theft in the record.
View Visitacion Valley coverage →
 Treasure Island
189 incidents — the smallest count AMB covers. The exposure is duration: fencing that stands across years of build phases.
View Treasure Island coverage →
Treasure Island
189 incidents — the smallest count AMB covers. The exposure is duration: fencing that stands across years of build phases.
View Treasure Island coverage →
 Lakeshore
241 shoplifting and 240 larceny reports — around Stonestown the retail floor carries as much loss as the parking fields.
View Lakeshore coverage →
Lakeshore
241 shoplifting and 240 larceny reports — around Stonestown the retail floor carries as much loss as the parking fields.
View Lakeshore coverage →
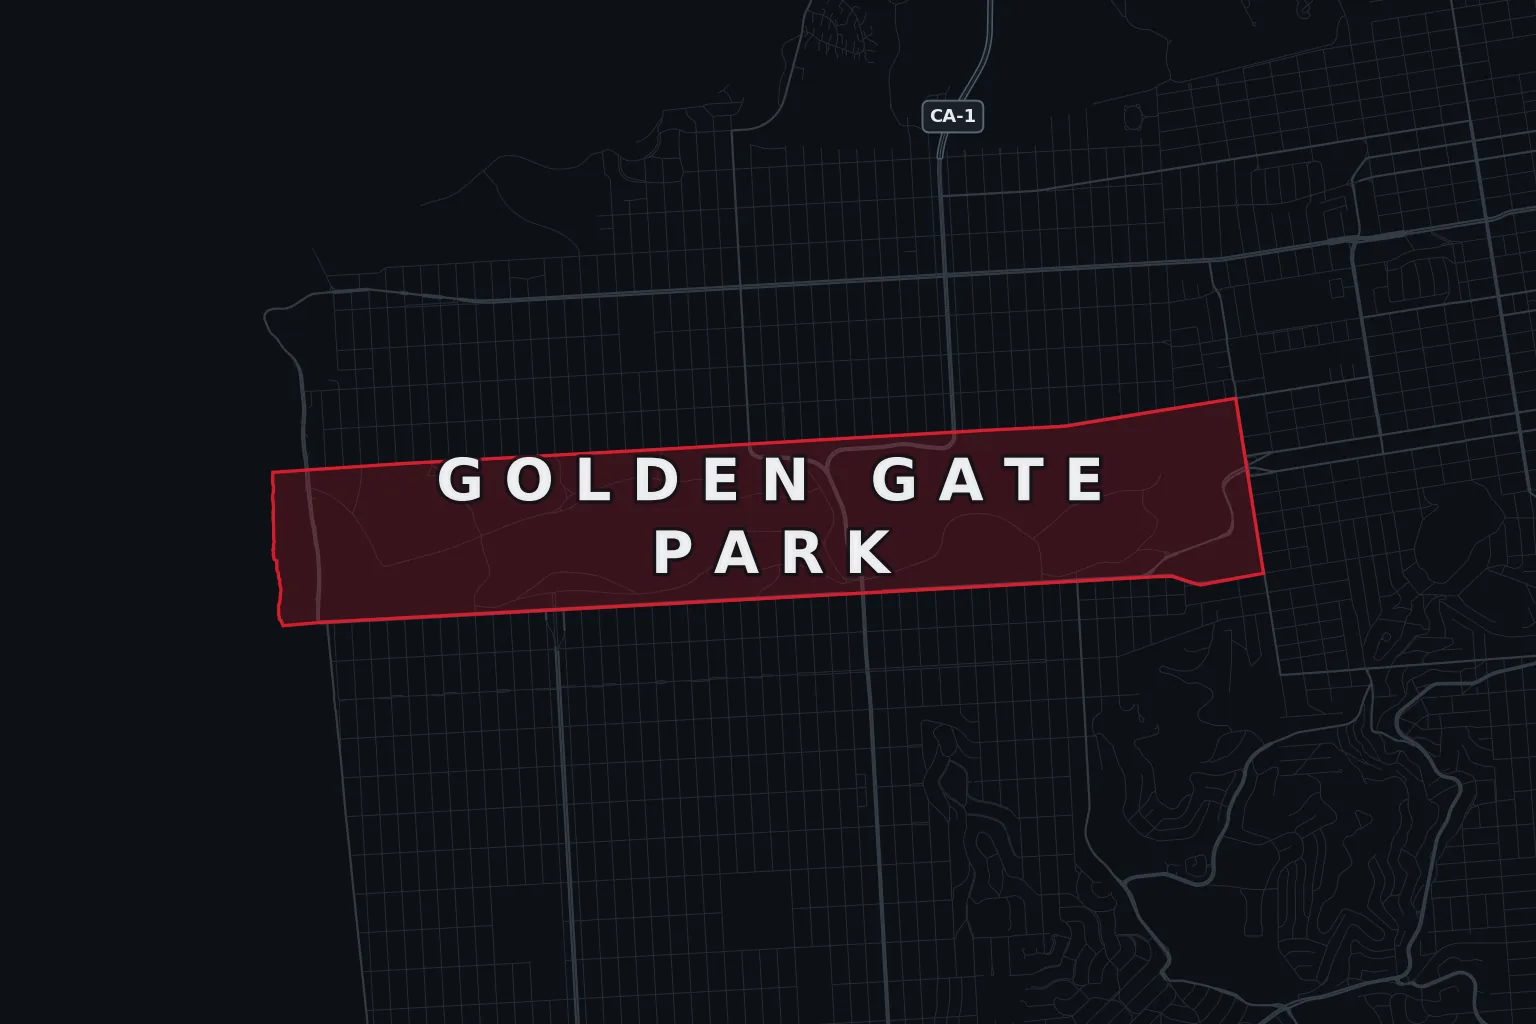 Golden Gate Park
Music Concourse lots serving the de Young and the Academy hold visitor vehicles for hours, drawing smash-and-grab crews to the loop.
View Golden Gate Park coverage →
Golden Gate Park
Music Concourse lots serving the de Young and the Academy hold visitor vehicles for hours, drawing smash-and-grab crews to the loop.
View Golden Gate Park coverage →
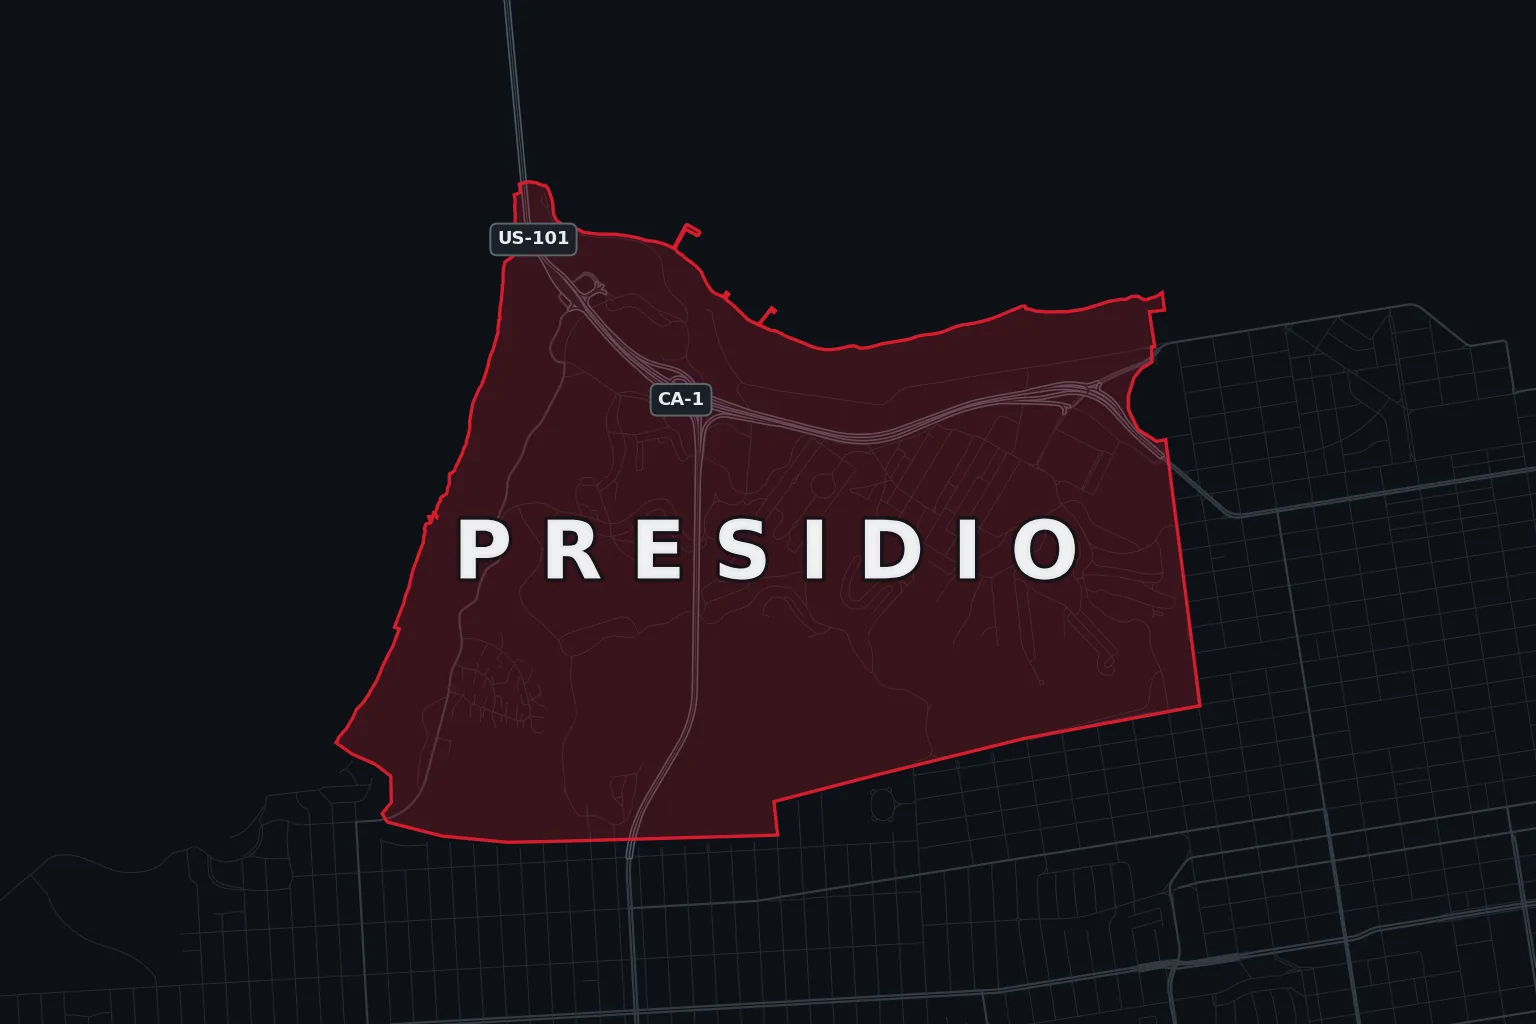 Presidio
Crissy Field, Baker Beach and the overlooks hold rental cars and luggage on predictable schedules — a daylight smash-and-grab environment.
View Presidio coverage →
Presidio
Crissy Field, Baker Beach and the overlooks hold rental cars and luggage on predictable schedules — a daylight smash-and-grab environment.
View Presidio coverage →
 Twin Peaks
The overlook is a long-running smash-and-grab target — bags visible through windows and fast downhill exits for crews.
View Twin Peaks coverage →
Twin Peaks
The overlook is a long-running smash-and-grab target — bags visible through windows and fast downhill exits for crews.
View Twin Peaks coverage →
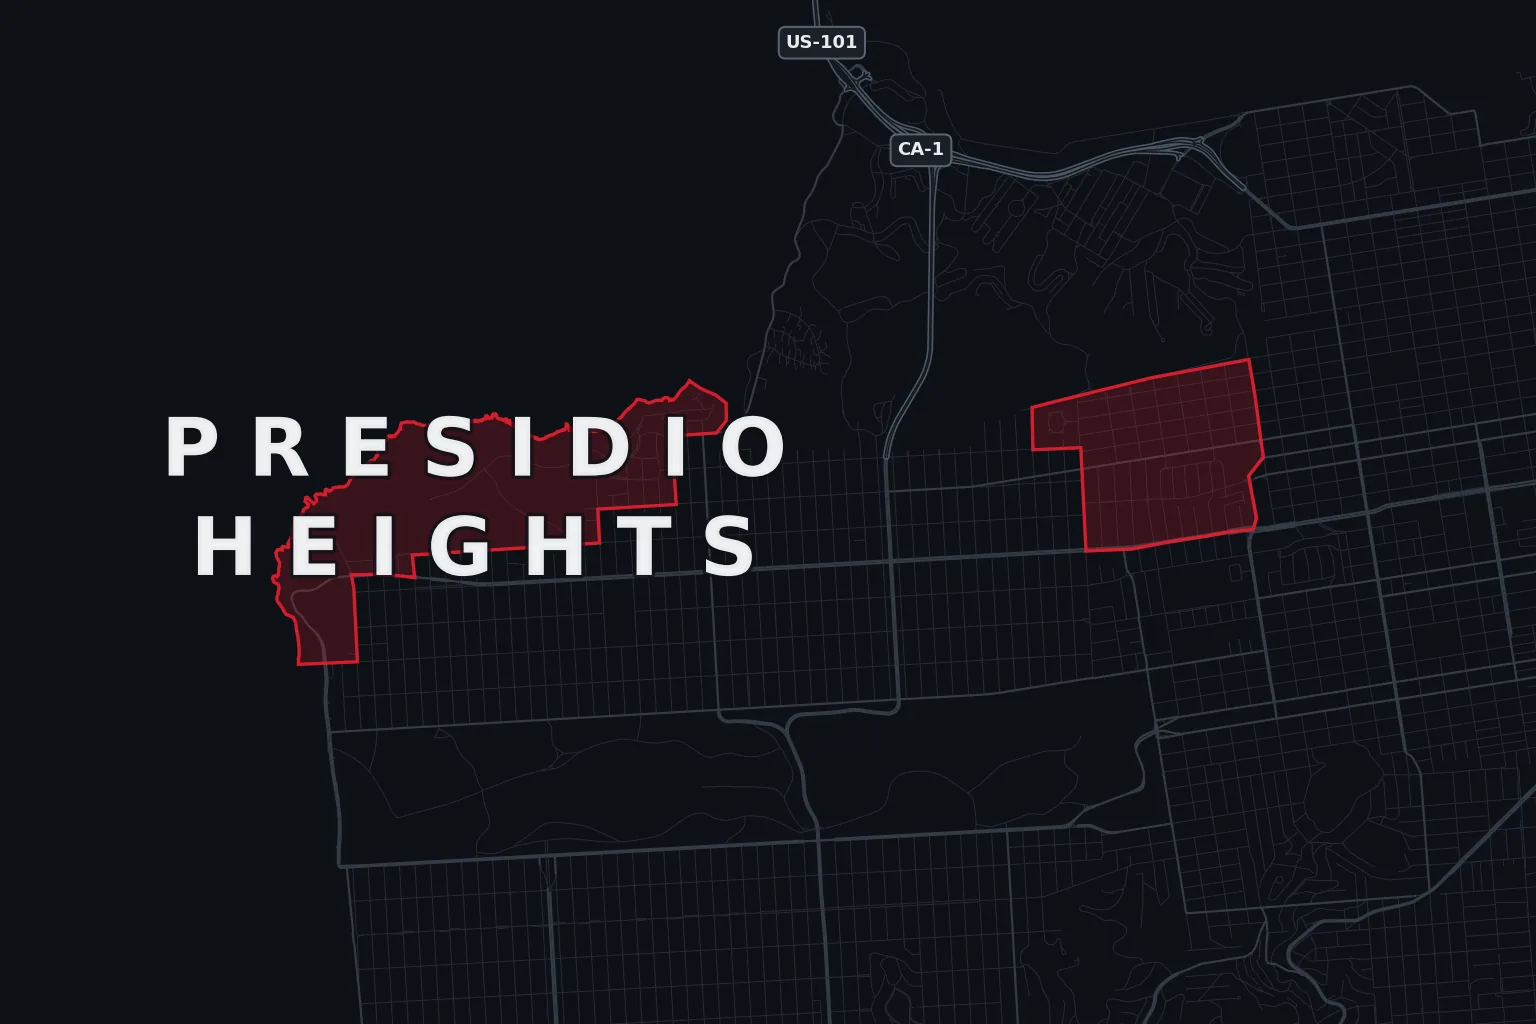 Presidio Heights
368 incidents a year on the estate blocks off the Presidio wall; the real question is whether anyone is watching at all.
View Presidio Heights coverage →
Presidio Heights
368 incidents a year on the estate blocks off the Presidio wall; the real question is whether anyone is watching at all.
View Presidio Heights coverage →
From the hub